Process Monitor
Purpose of the plugin
In the Process Monitor module, users can monitor processes from the Online Media Net and intervene to regulate them if necessary.
Introduction
The Process Monitor is used to monitor current and completed processes. These can be checked and managed at the same time.
Each process contains specific detailed information, which can be found on the right side.
|
The Process Monitor is only available for standard processes (e.g. downloads, file deletion, synchronization, …). A selection of which processes can be displayed can be made in the Configuration Client. |
Prerequisites and relations to other modules
To be able to see processes in the Process Monitor, processes must first be executed or completed.
As only standard processes are displayed, files in DAM and various functions (e.g. delete, download, move to shopping cart, …) are required.
How to access
The Process Monitor plugin can be opened via the sidebar. It can often be found in the administration area.
How to use
The Process Monitor consists of a center and right view.
No left view is required for navigation or similar.
-
Center View
Display of the processes -
Right View
Process-relevant detailed information
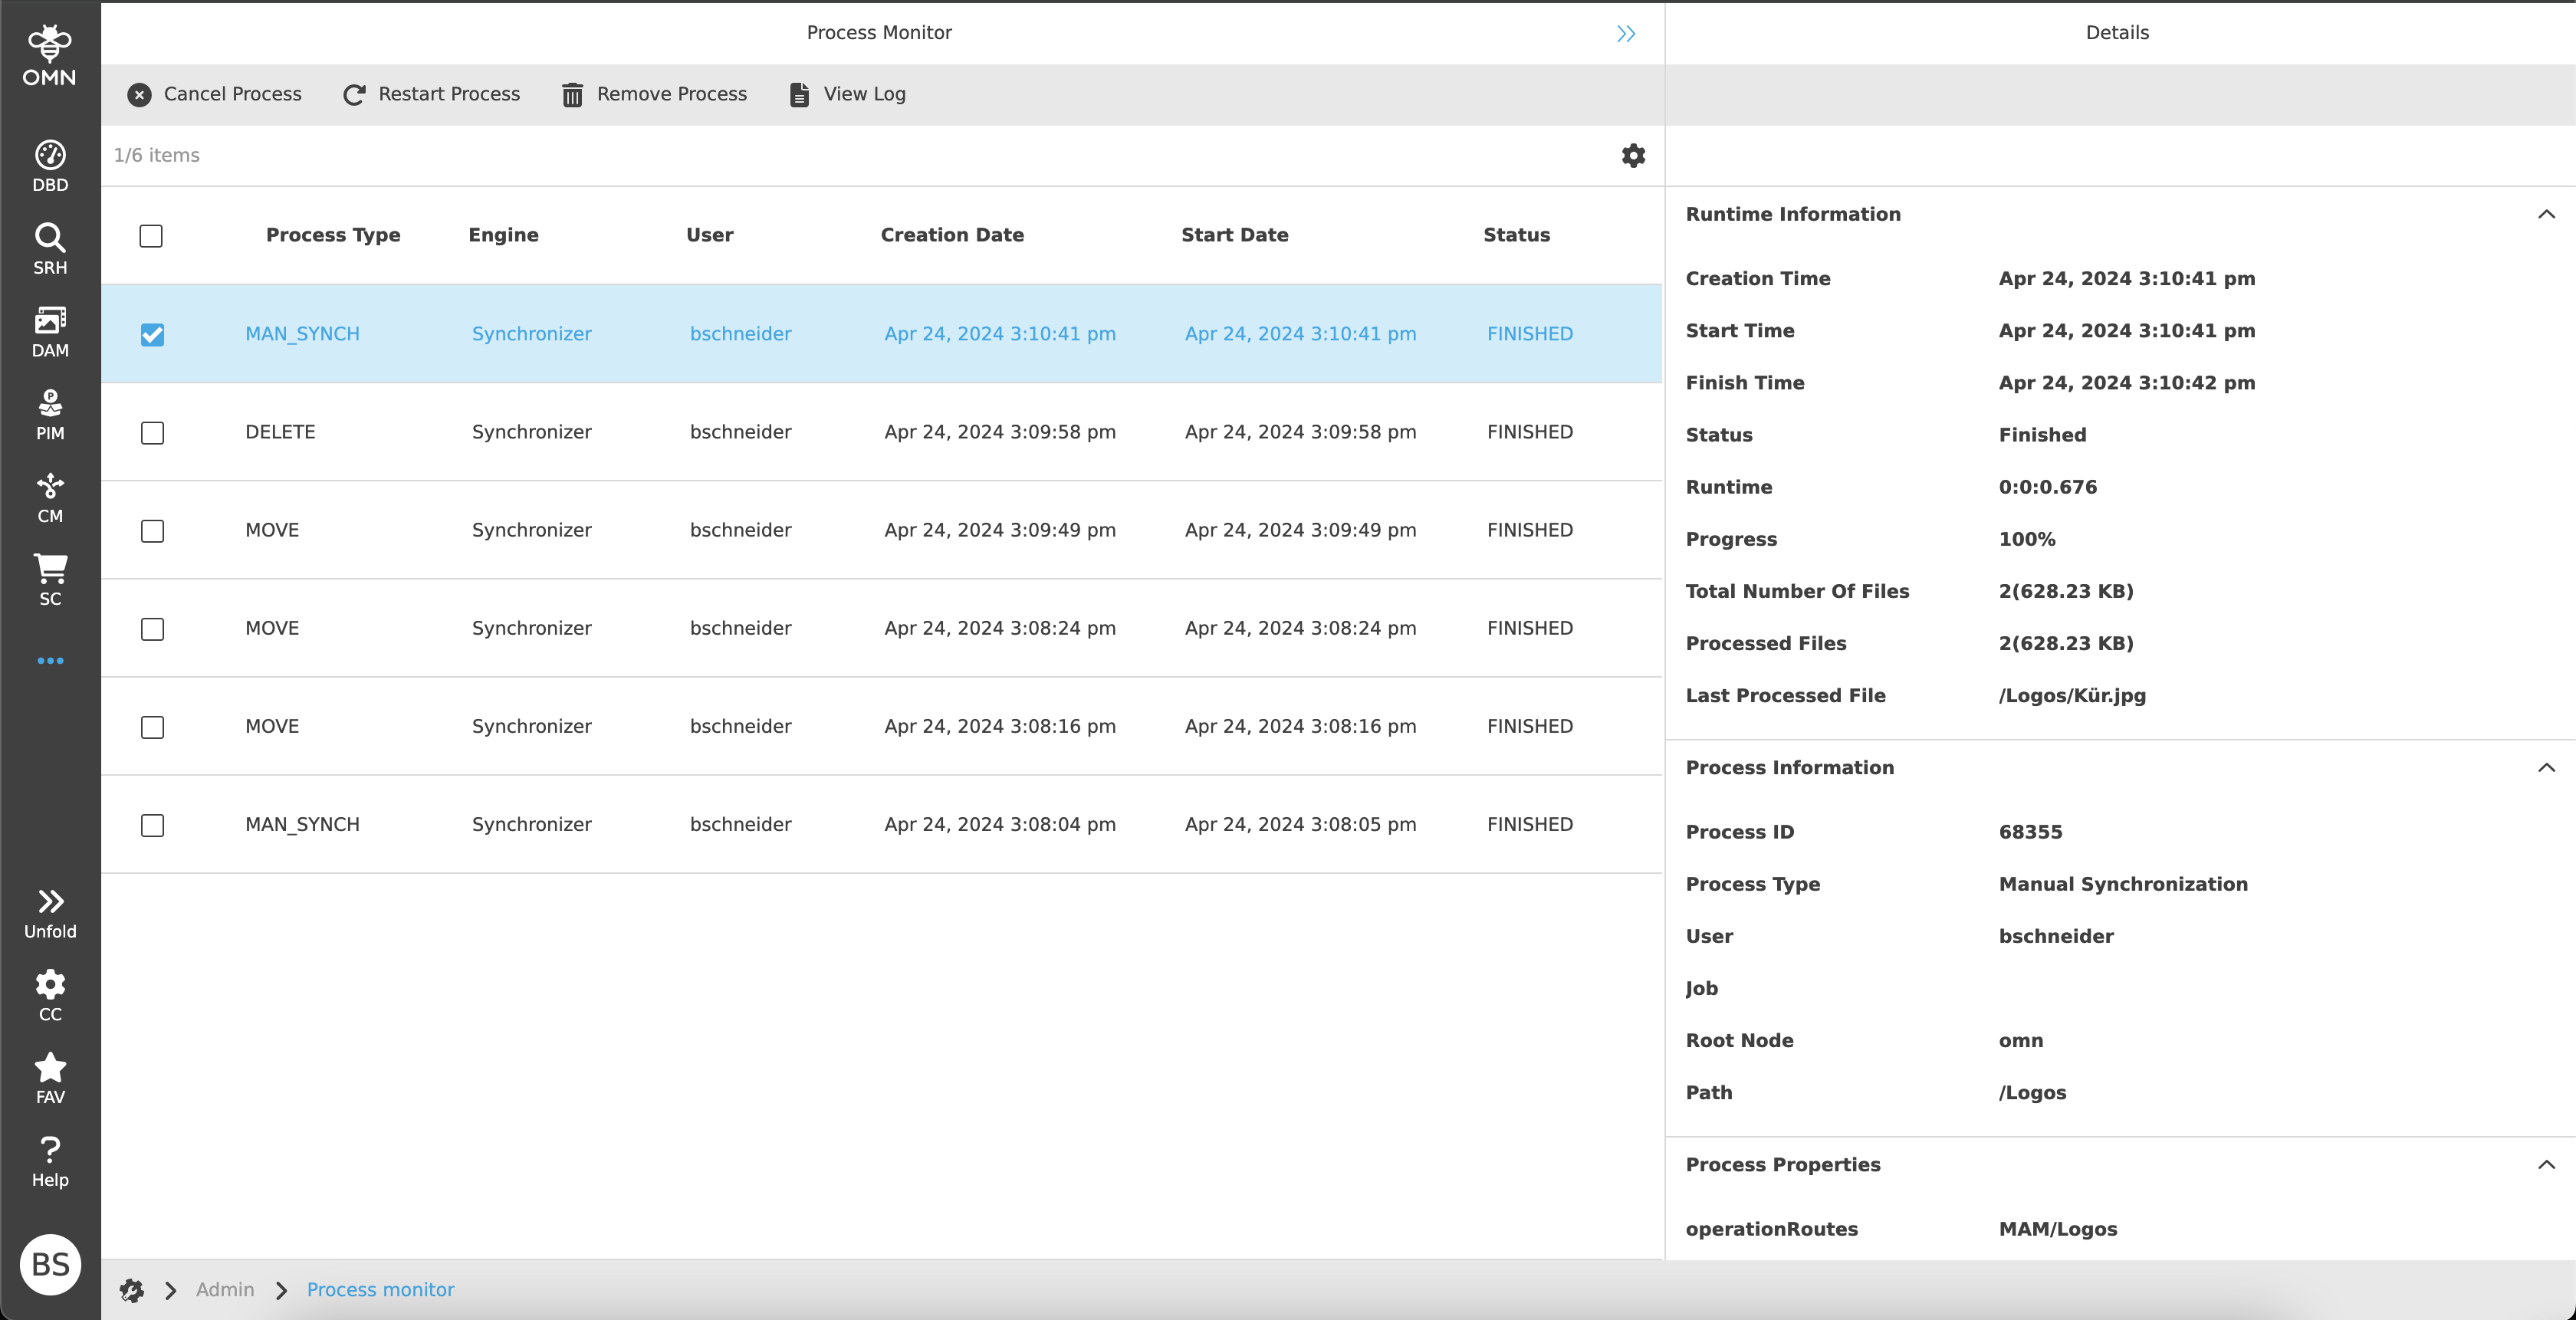
Center View
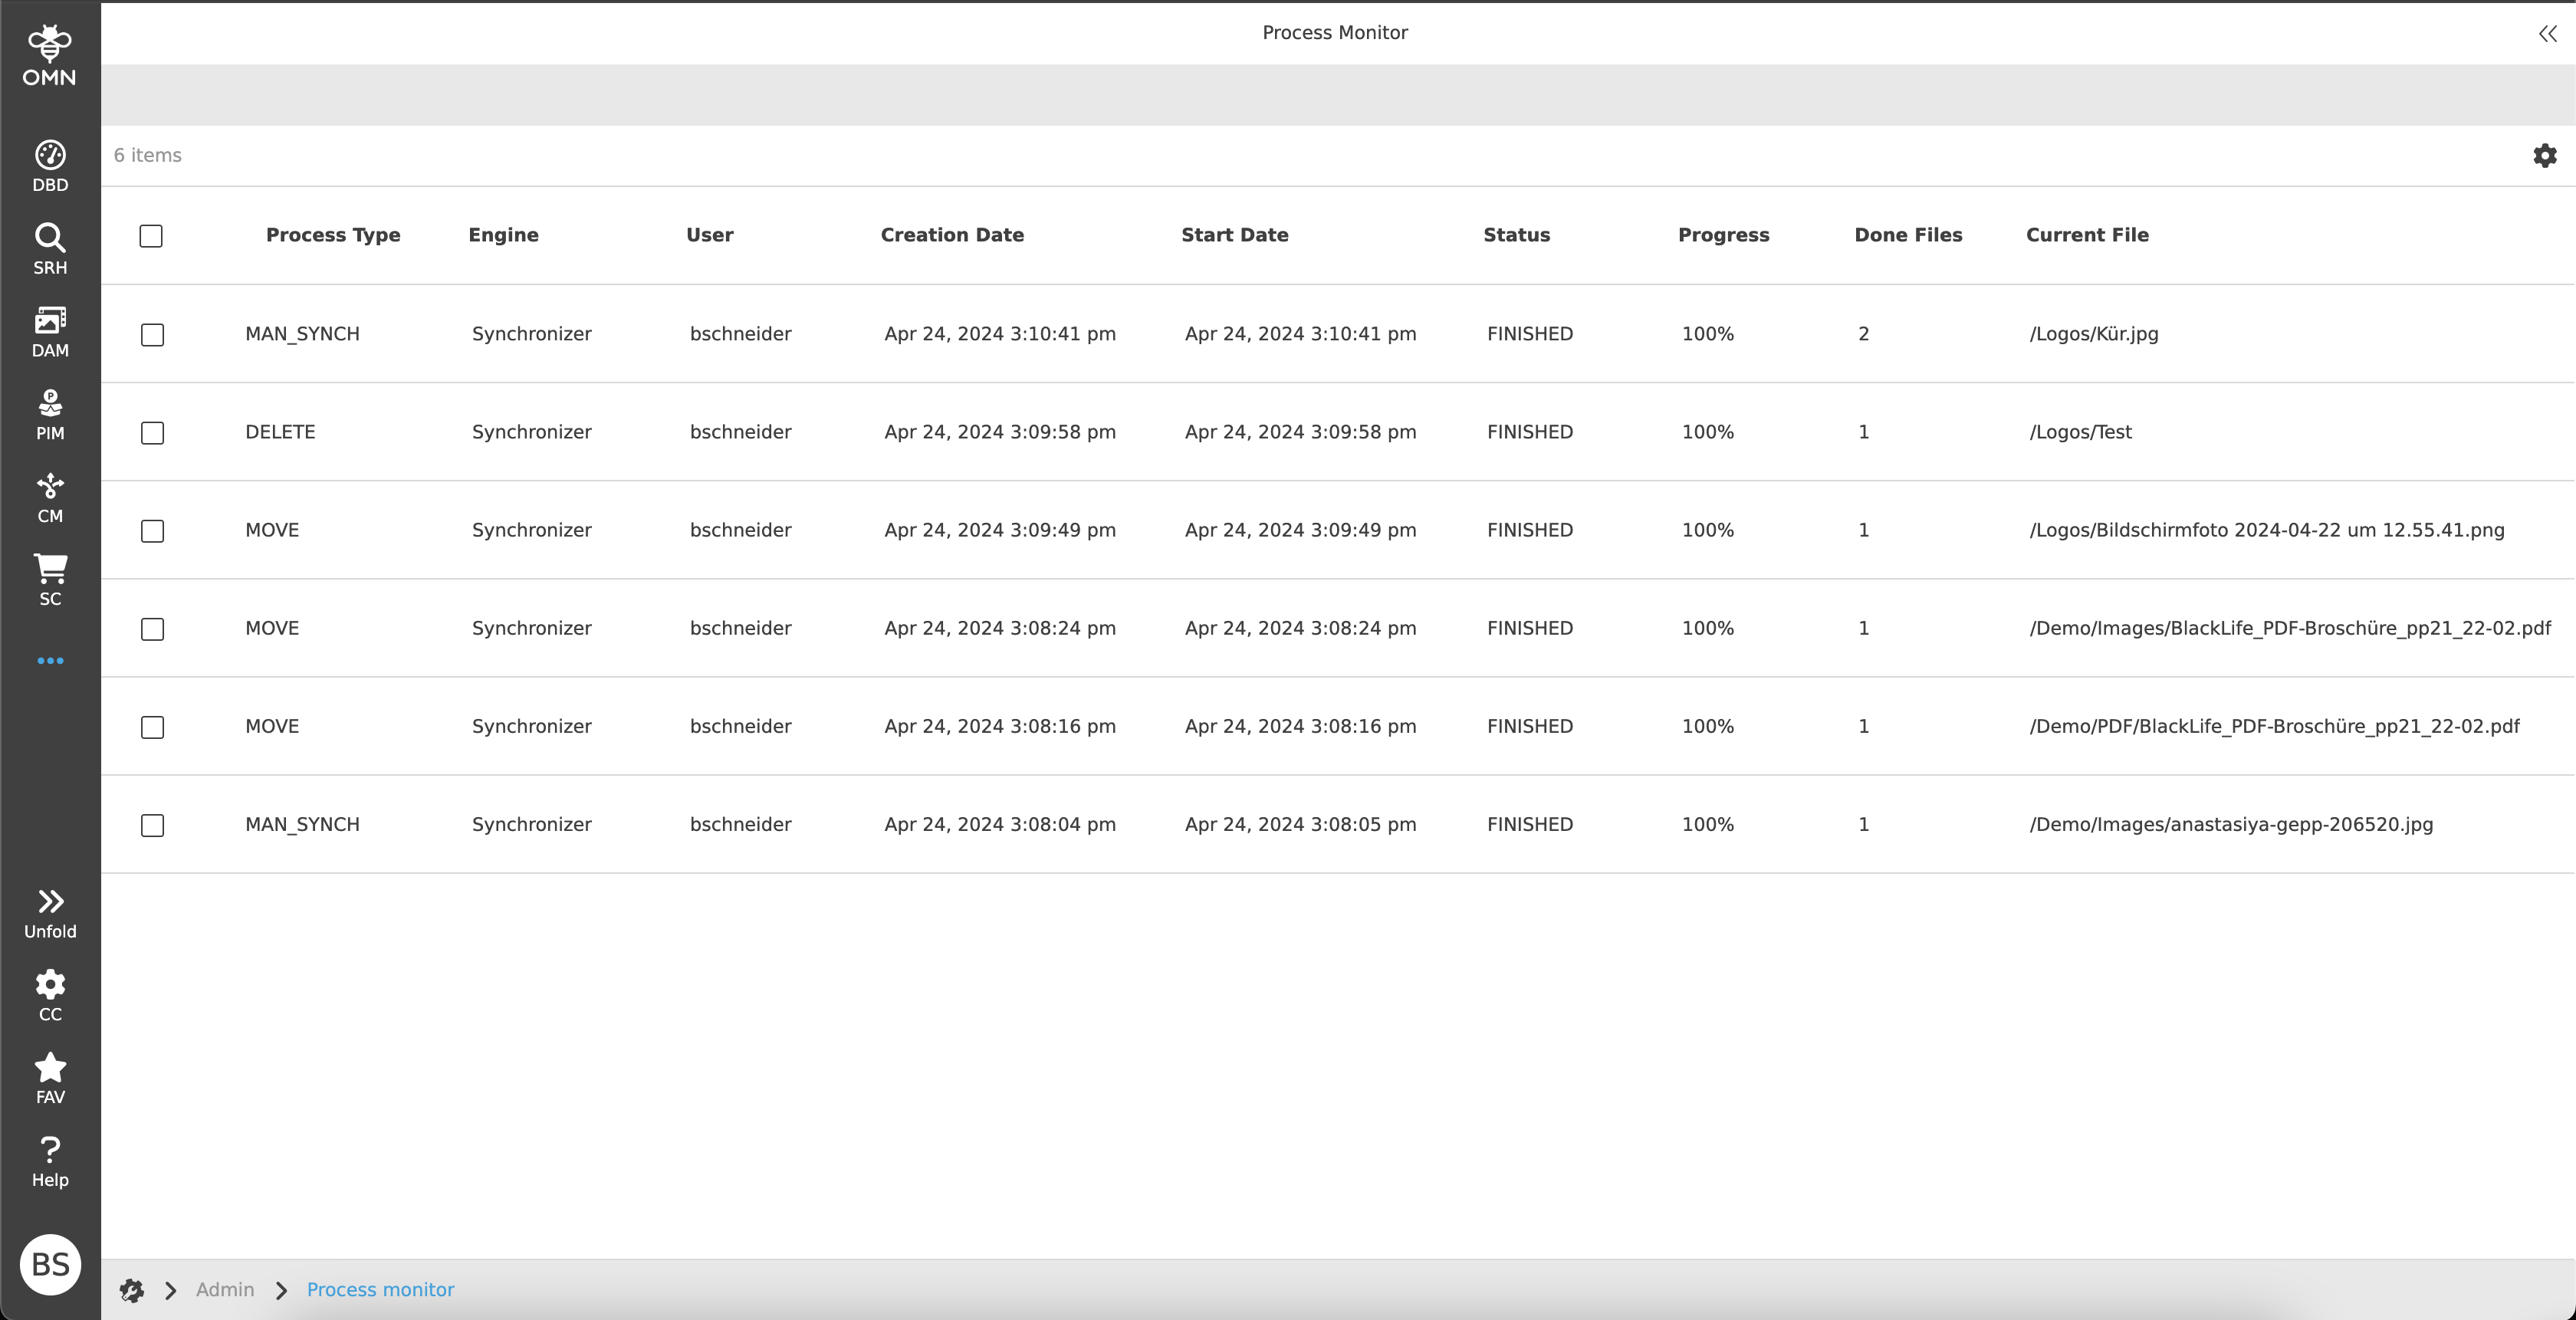
All processes are displayed in tabular form in the center panel.
| Processes are displayed for a period of 4 weeks. They are then hidden. |
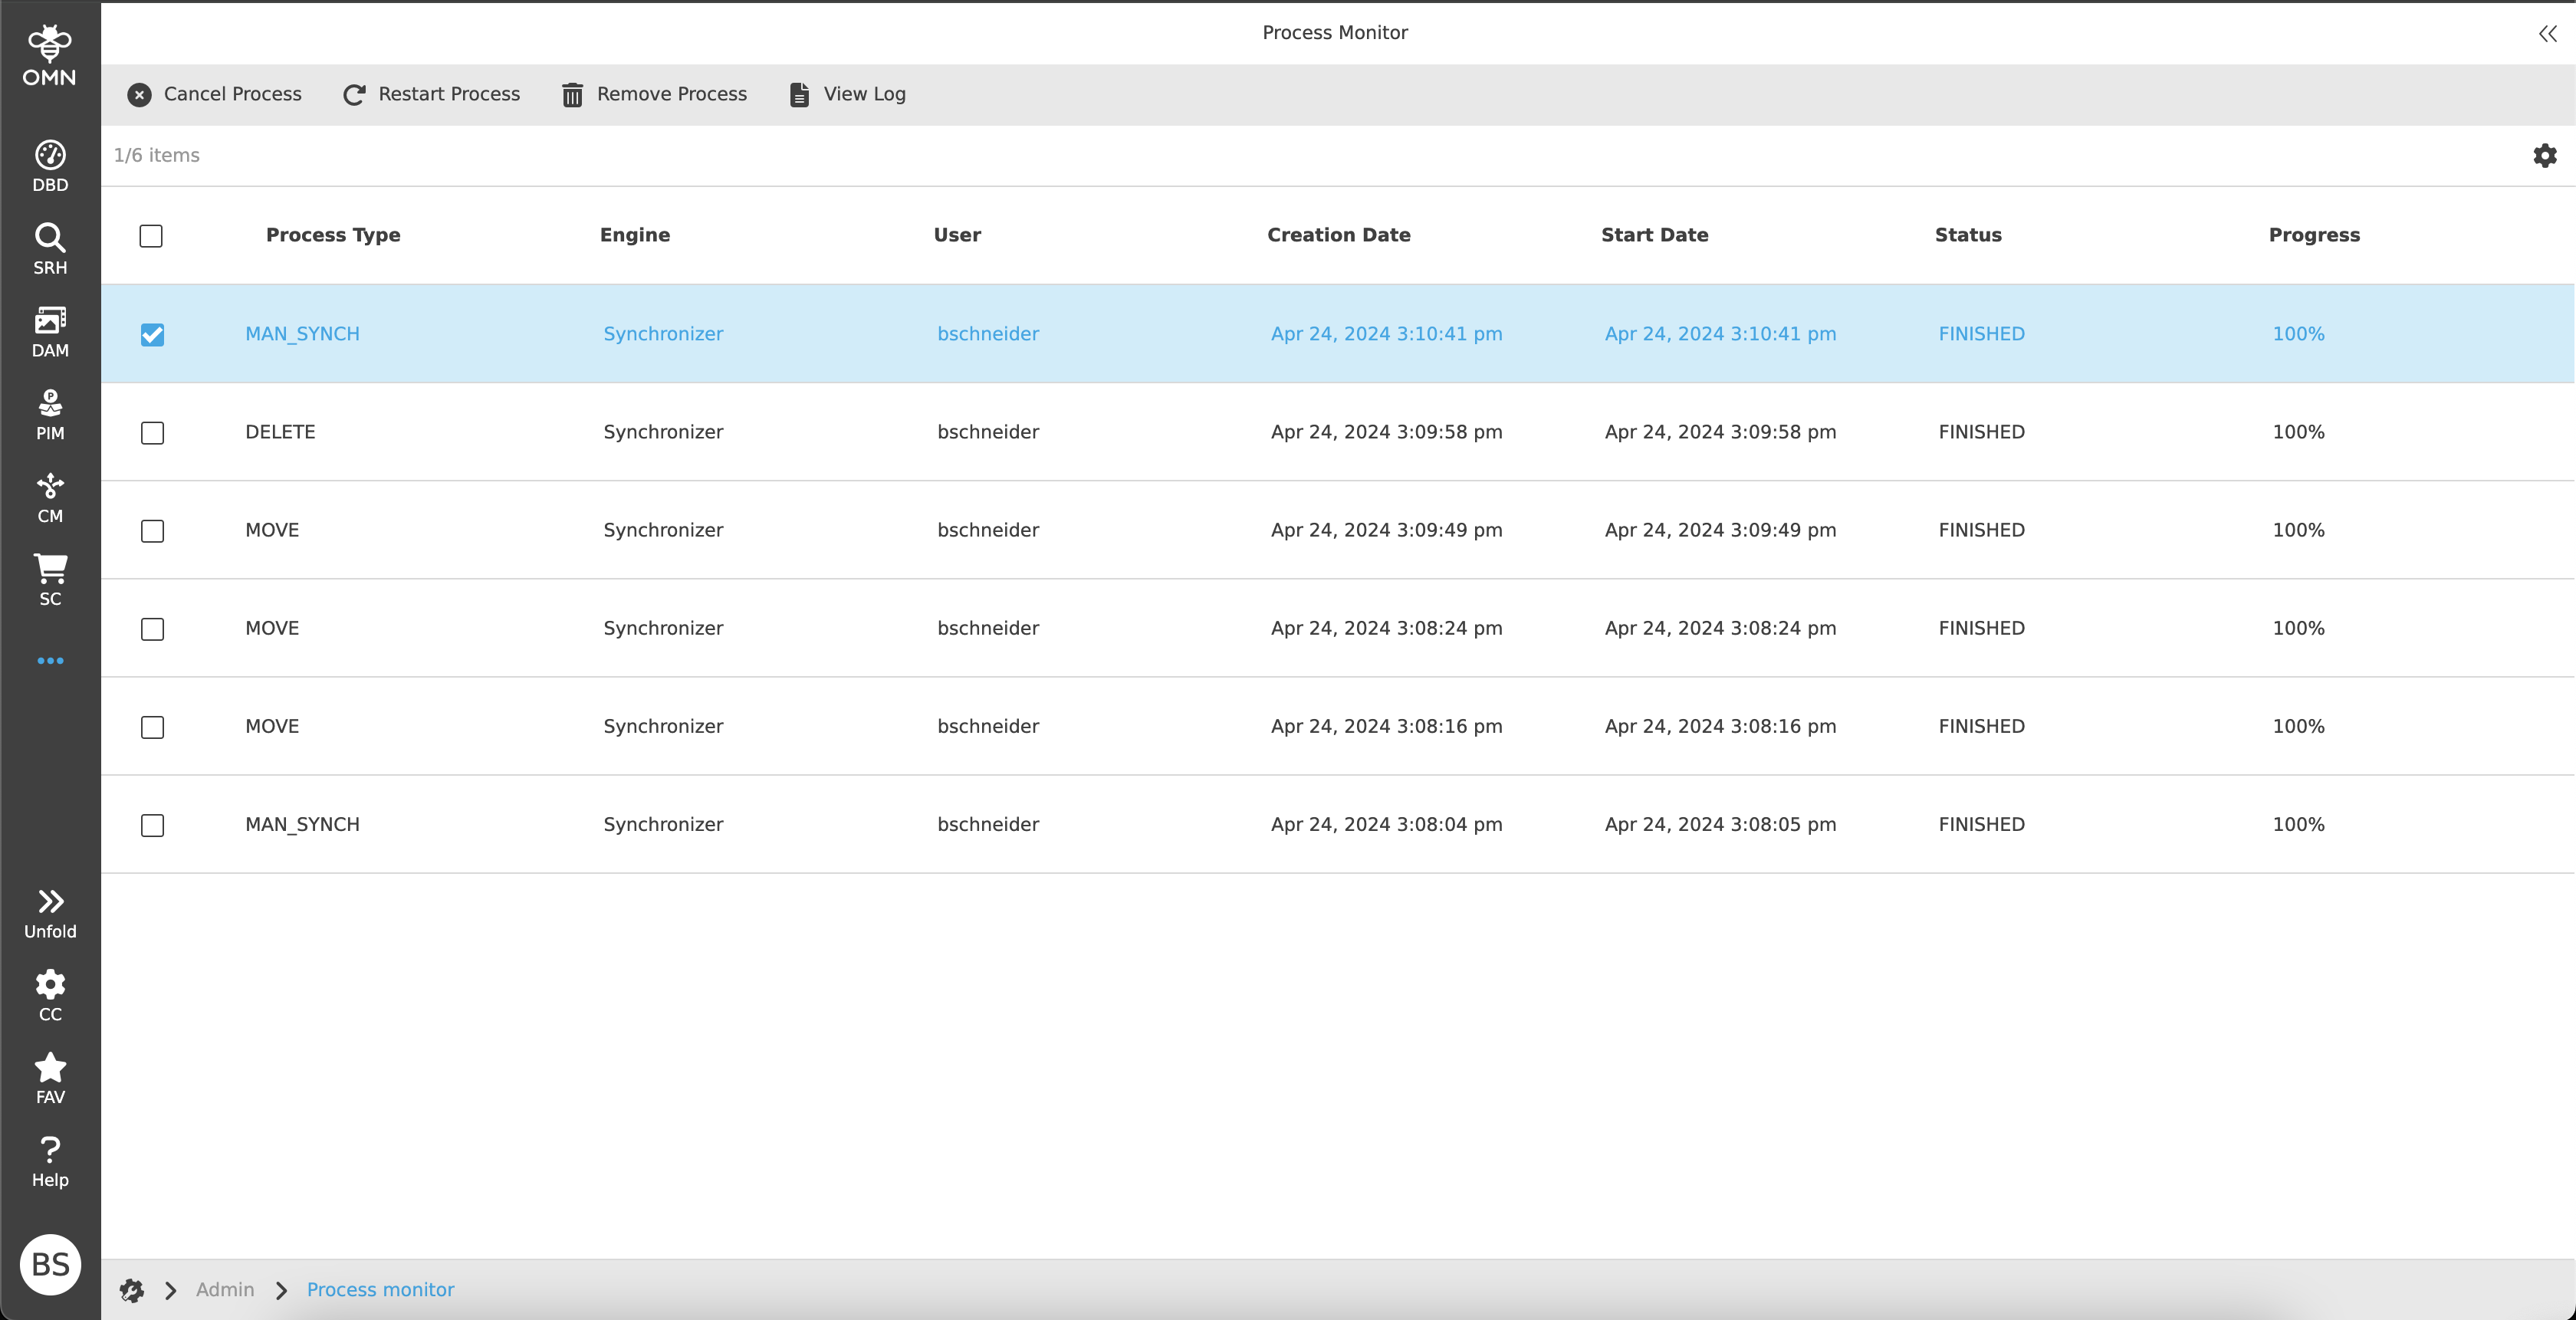
Toolbar & Functions
The following functions are generally available for the processes above the content area:
-
Cancel Process
-
If the process has not yet been completed, the process is canceled when the function is executed.
-
If the process has already been completed, executing the function has no effect.
-
-
Restart Process
-
Only certain process types can be restarted (e.g. archiving, copying, moving, manual synchronization, …).
-
Only processes that are in a completed state can be restarted.
-
Processes that are still running or completed processes with errors are blocked for restarting.
-
-
Remove Process
-
As soon as the function is executed and confirmed, the process is removed.
-
If the process is not finished, the process is canceled first.
-
If the process is finished, the process is marked as deleted.
-
-
View Log
-
This function can be used to view the relevant log entries of the currently selected process.
When the function is executed, the corresponding log file is opened in a new browser tab:-
The tab contains a table with log messages.
-
The columns of the table are Time, Type, Message and Exception.
-
When the user clicks on a row, the right view opens with the complete error message.
Log View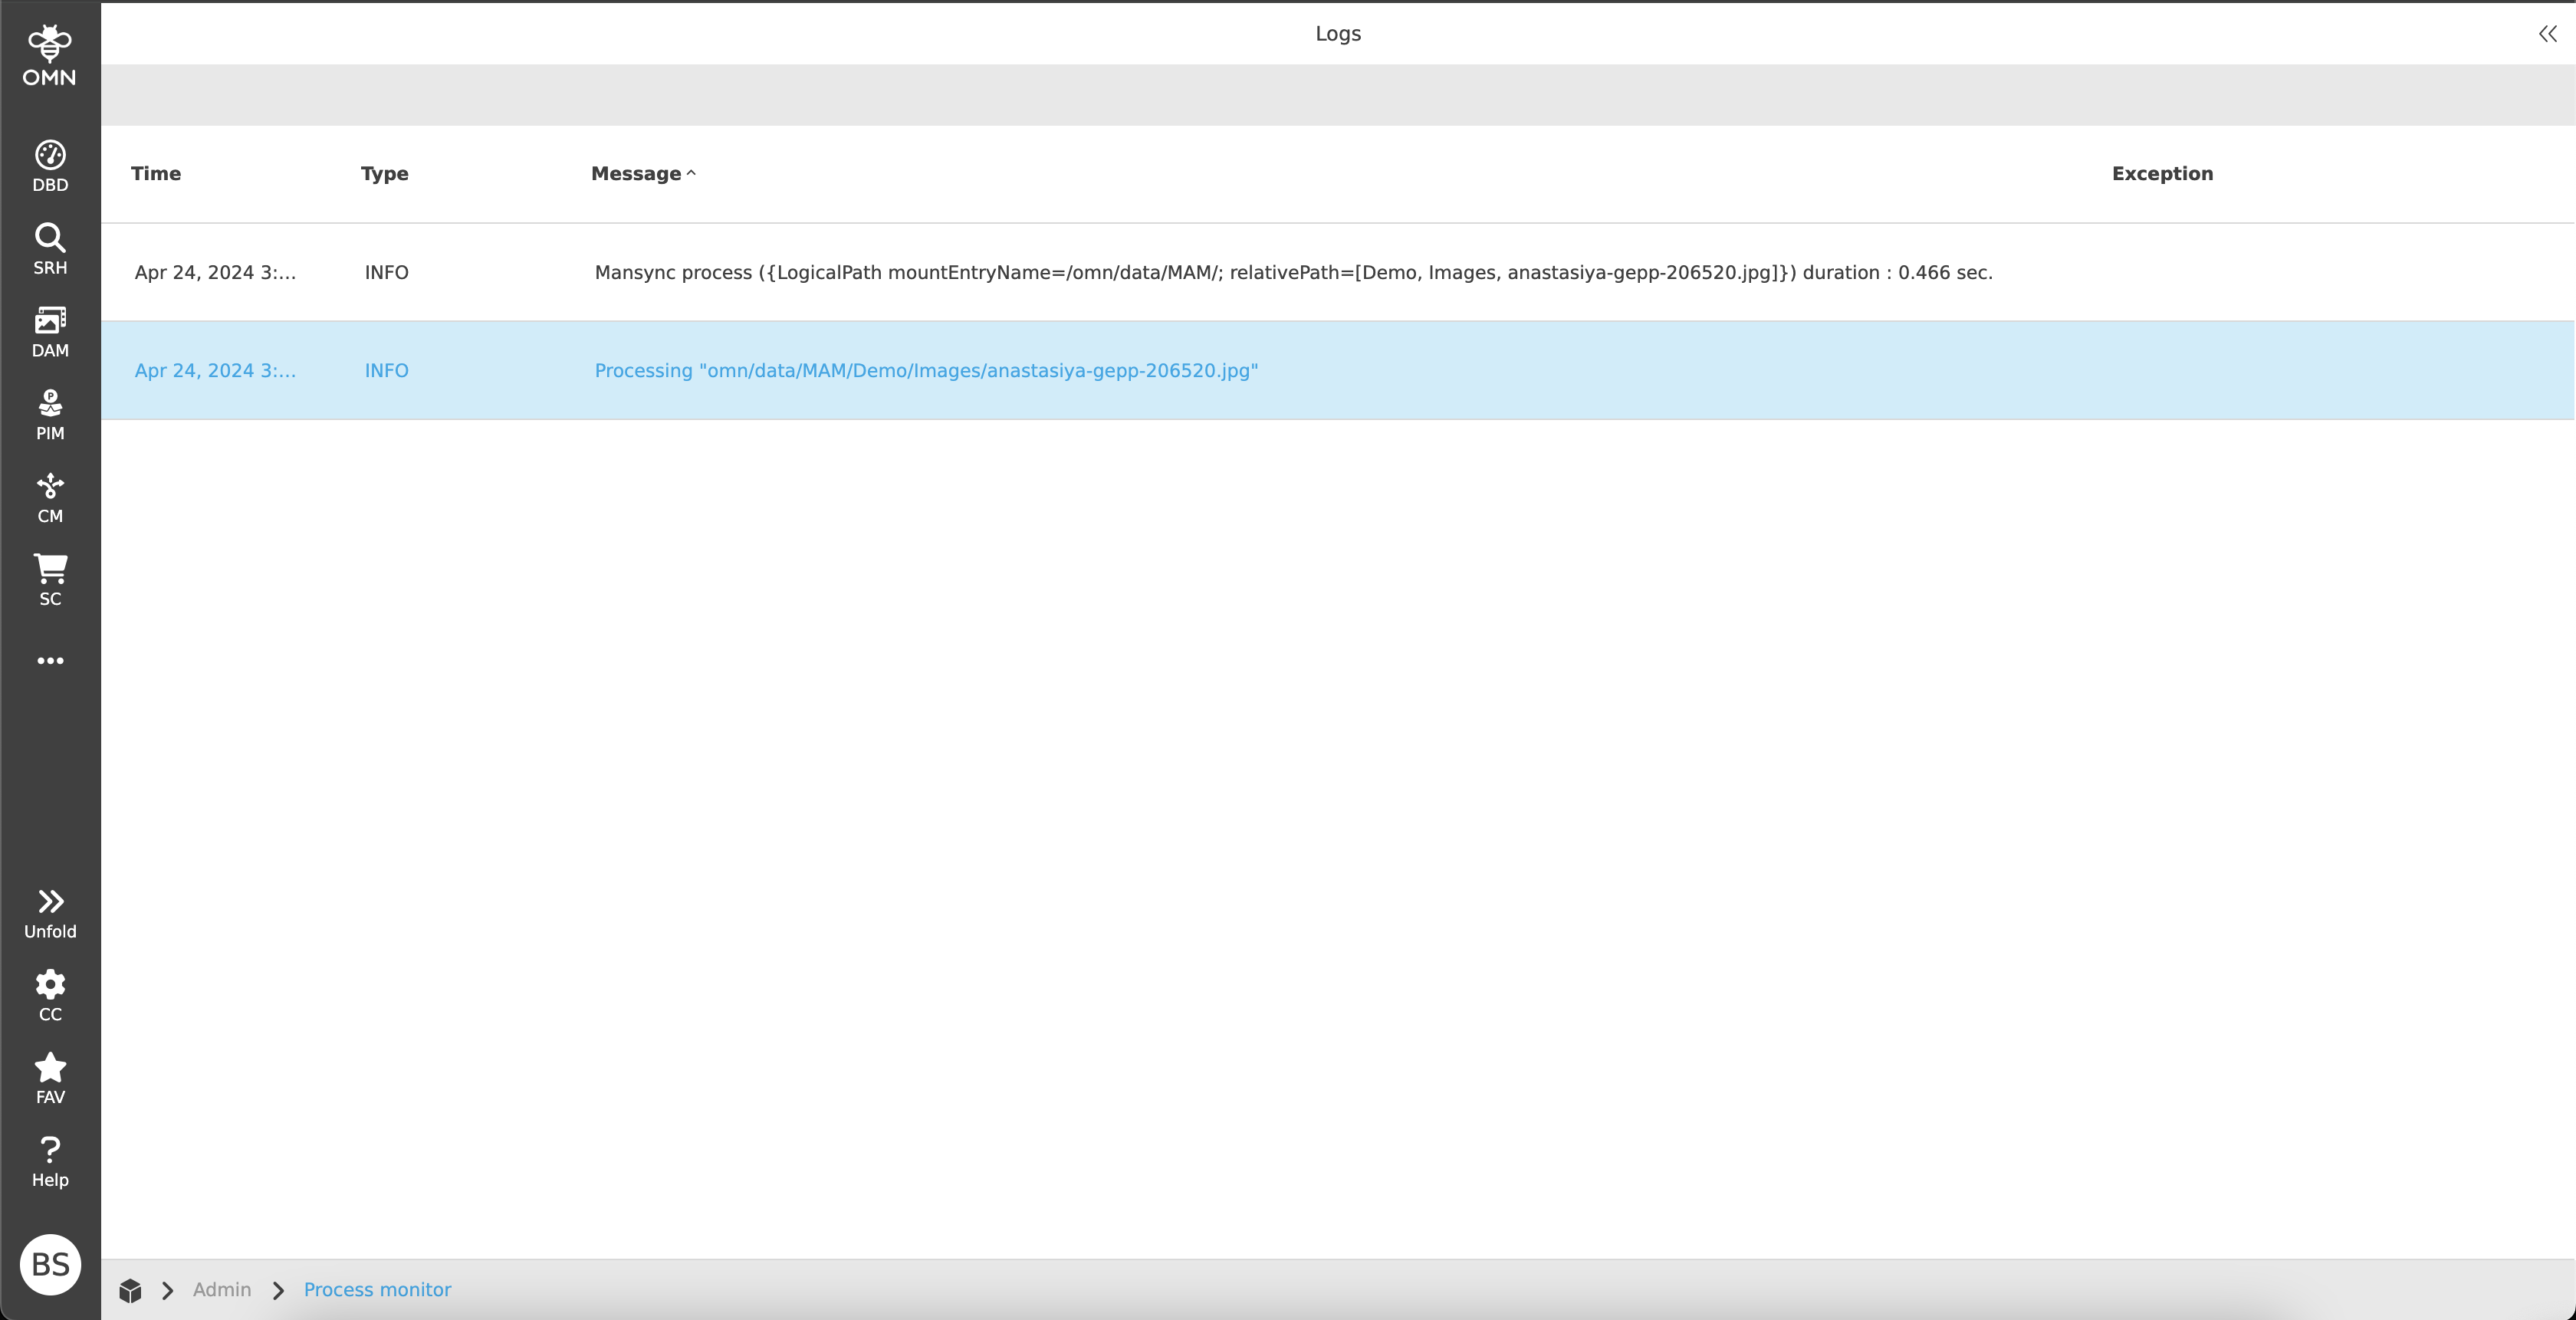
-
-
Statusbar & Settings
The statusbar contains an object counter on the left side, which shows the number of entries (processes) or selected entries.
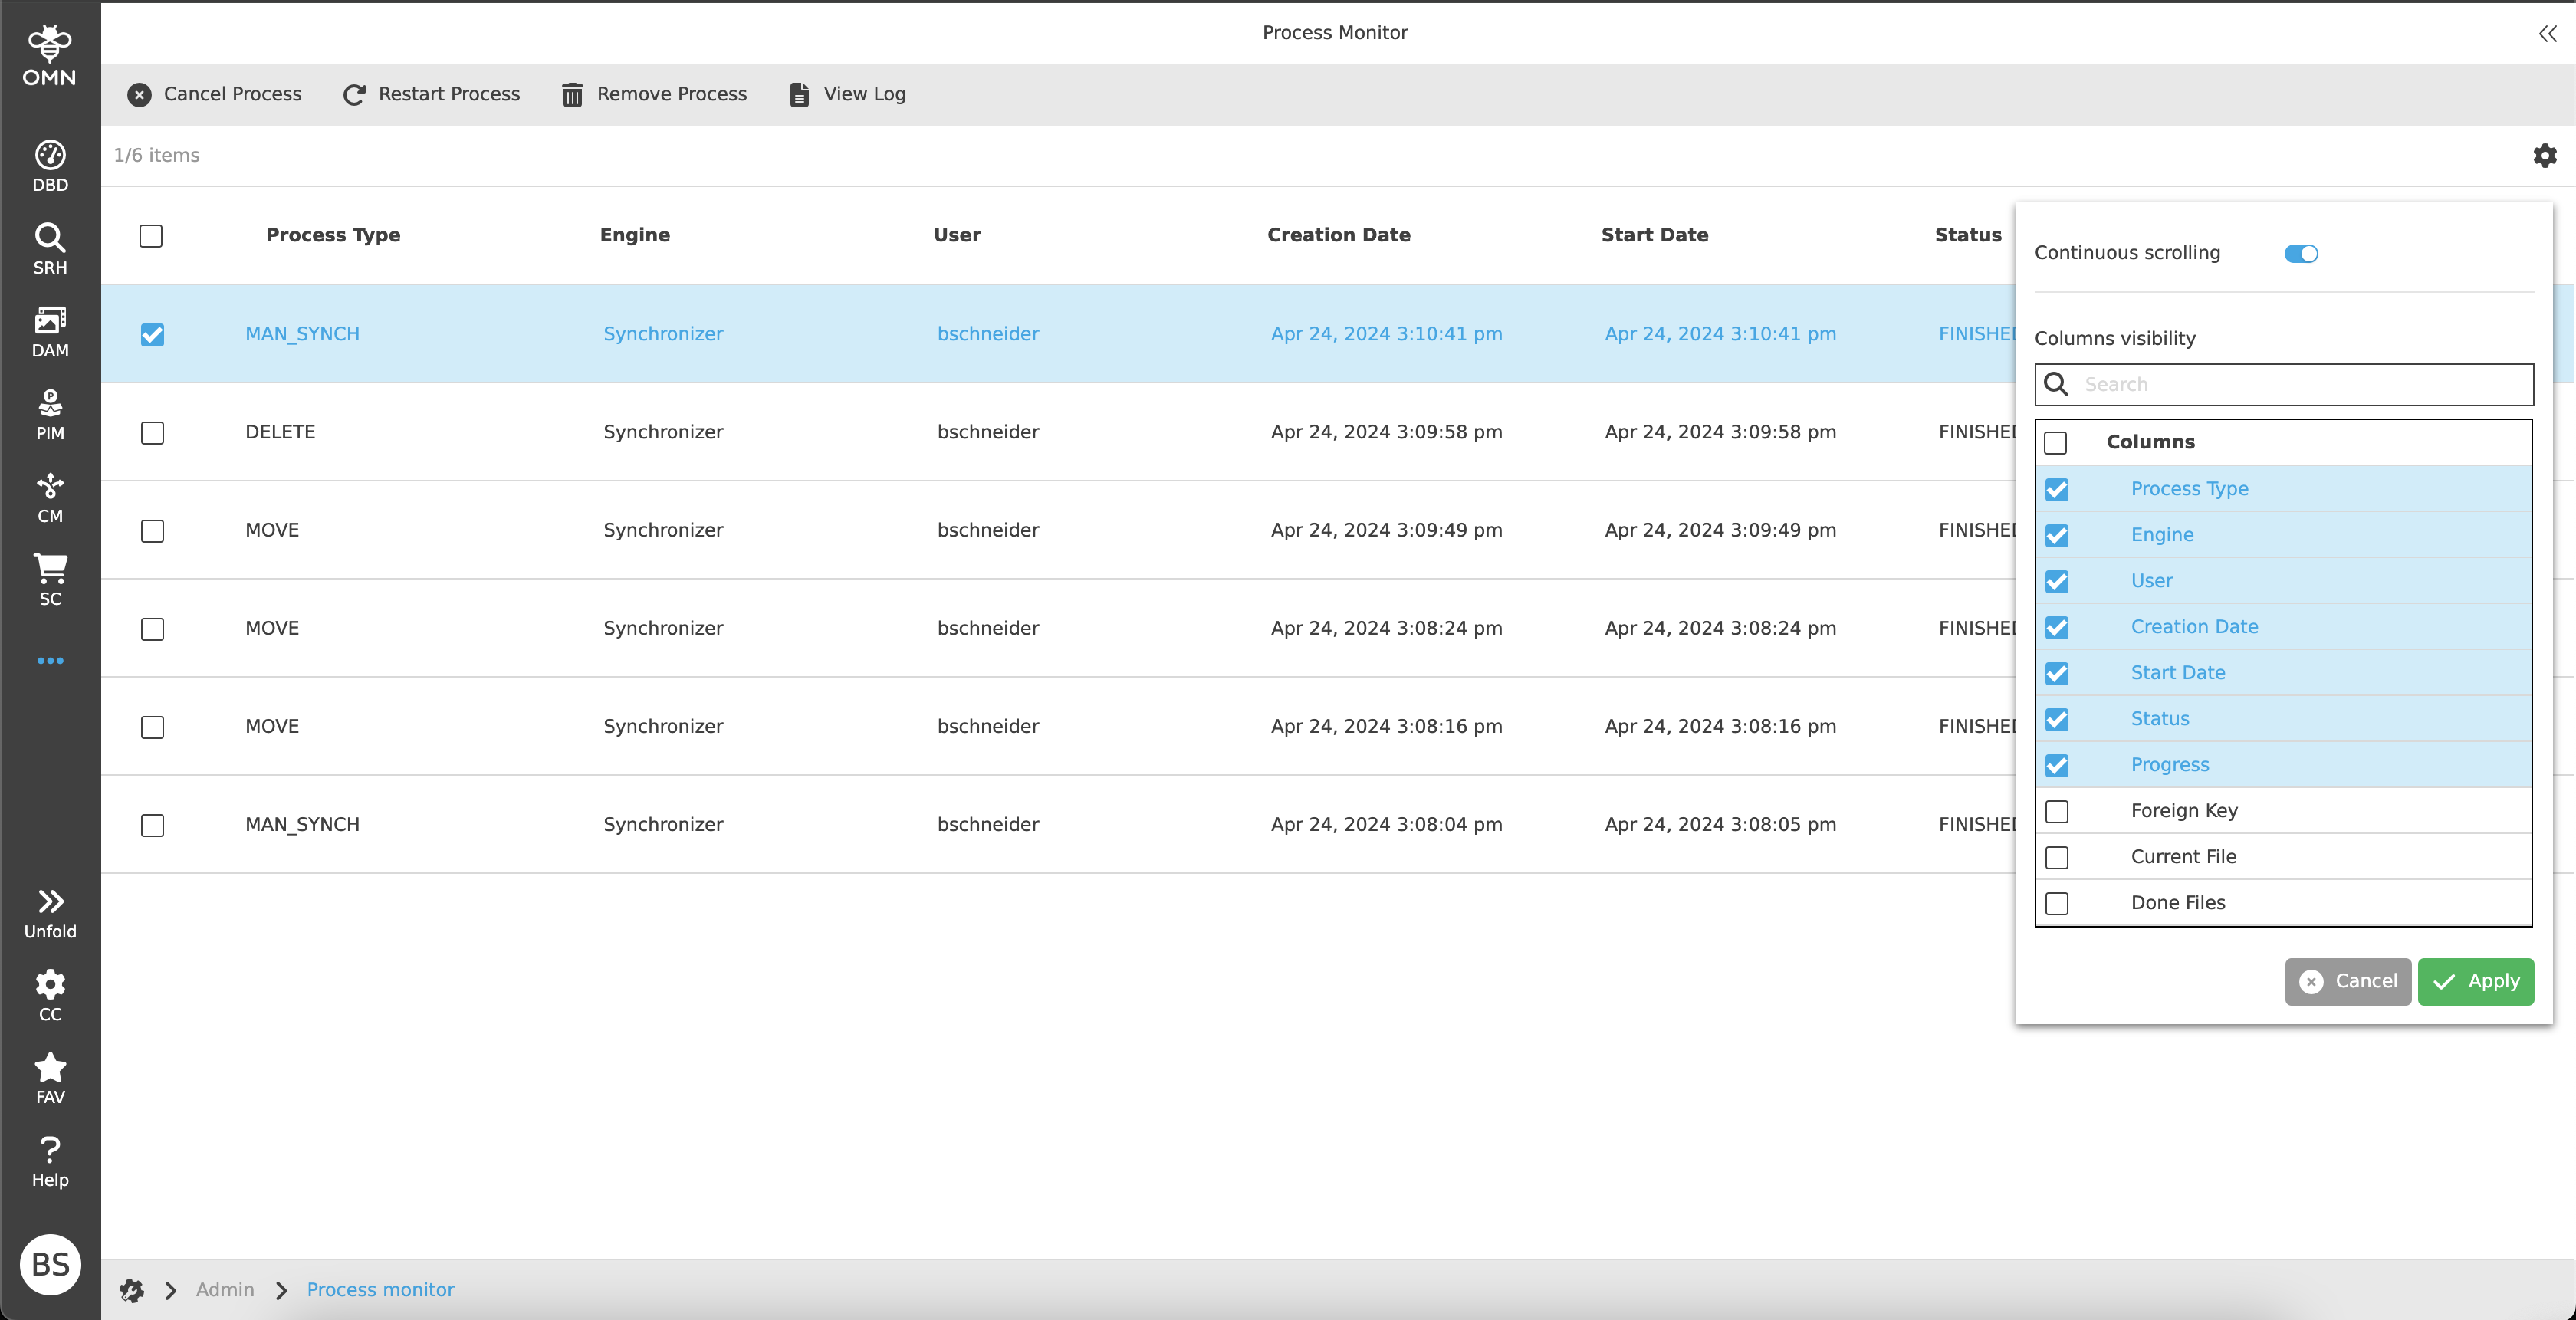
The statusbar settings are located on the right side.
In the statusbar settings, the user has the following options:
-
Continuous scrolling or pagination (how many elements should be displayed per page)
-
Column visibility
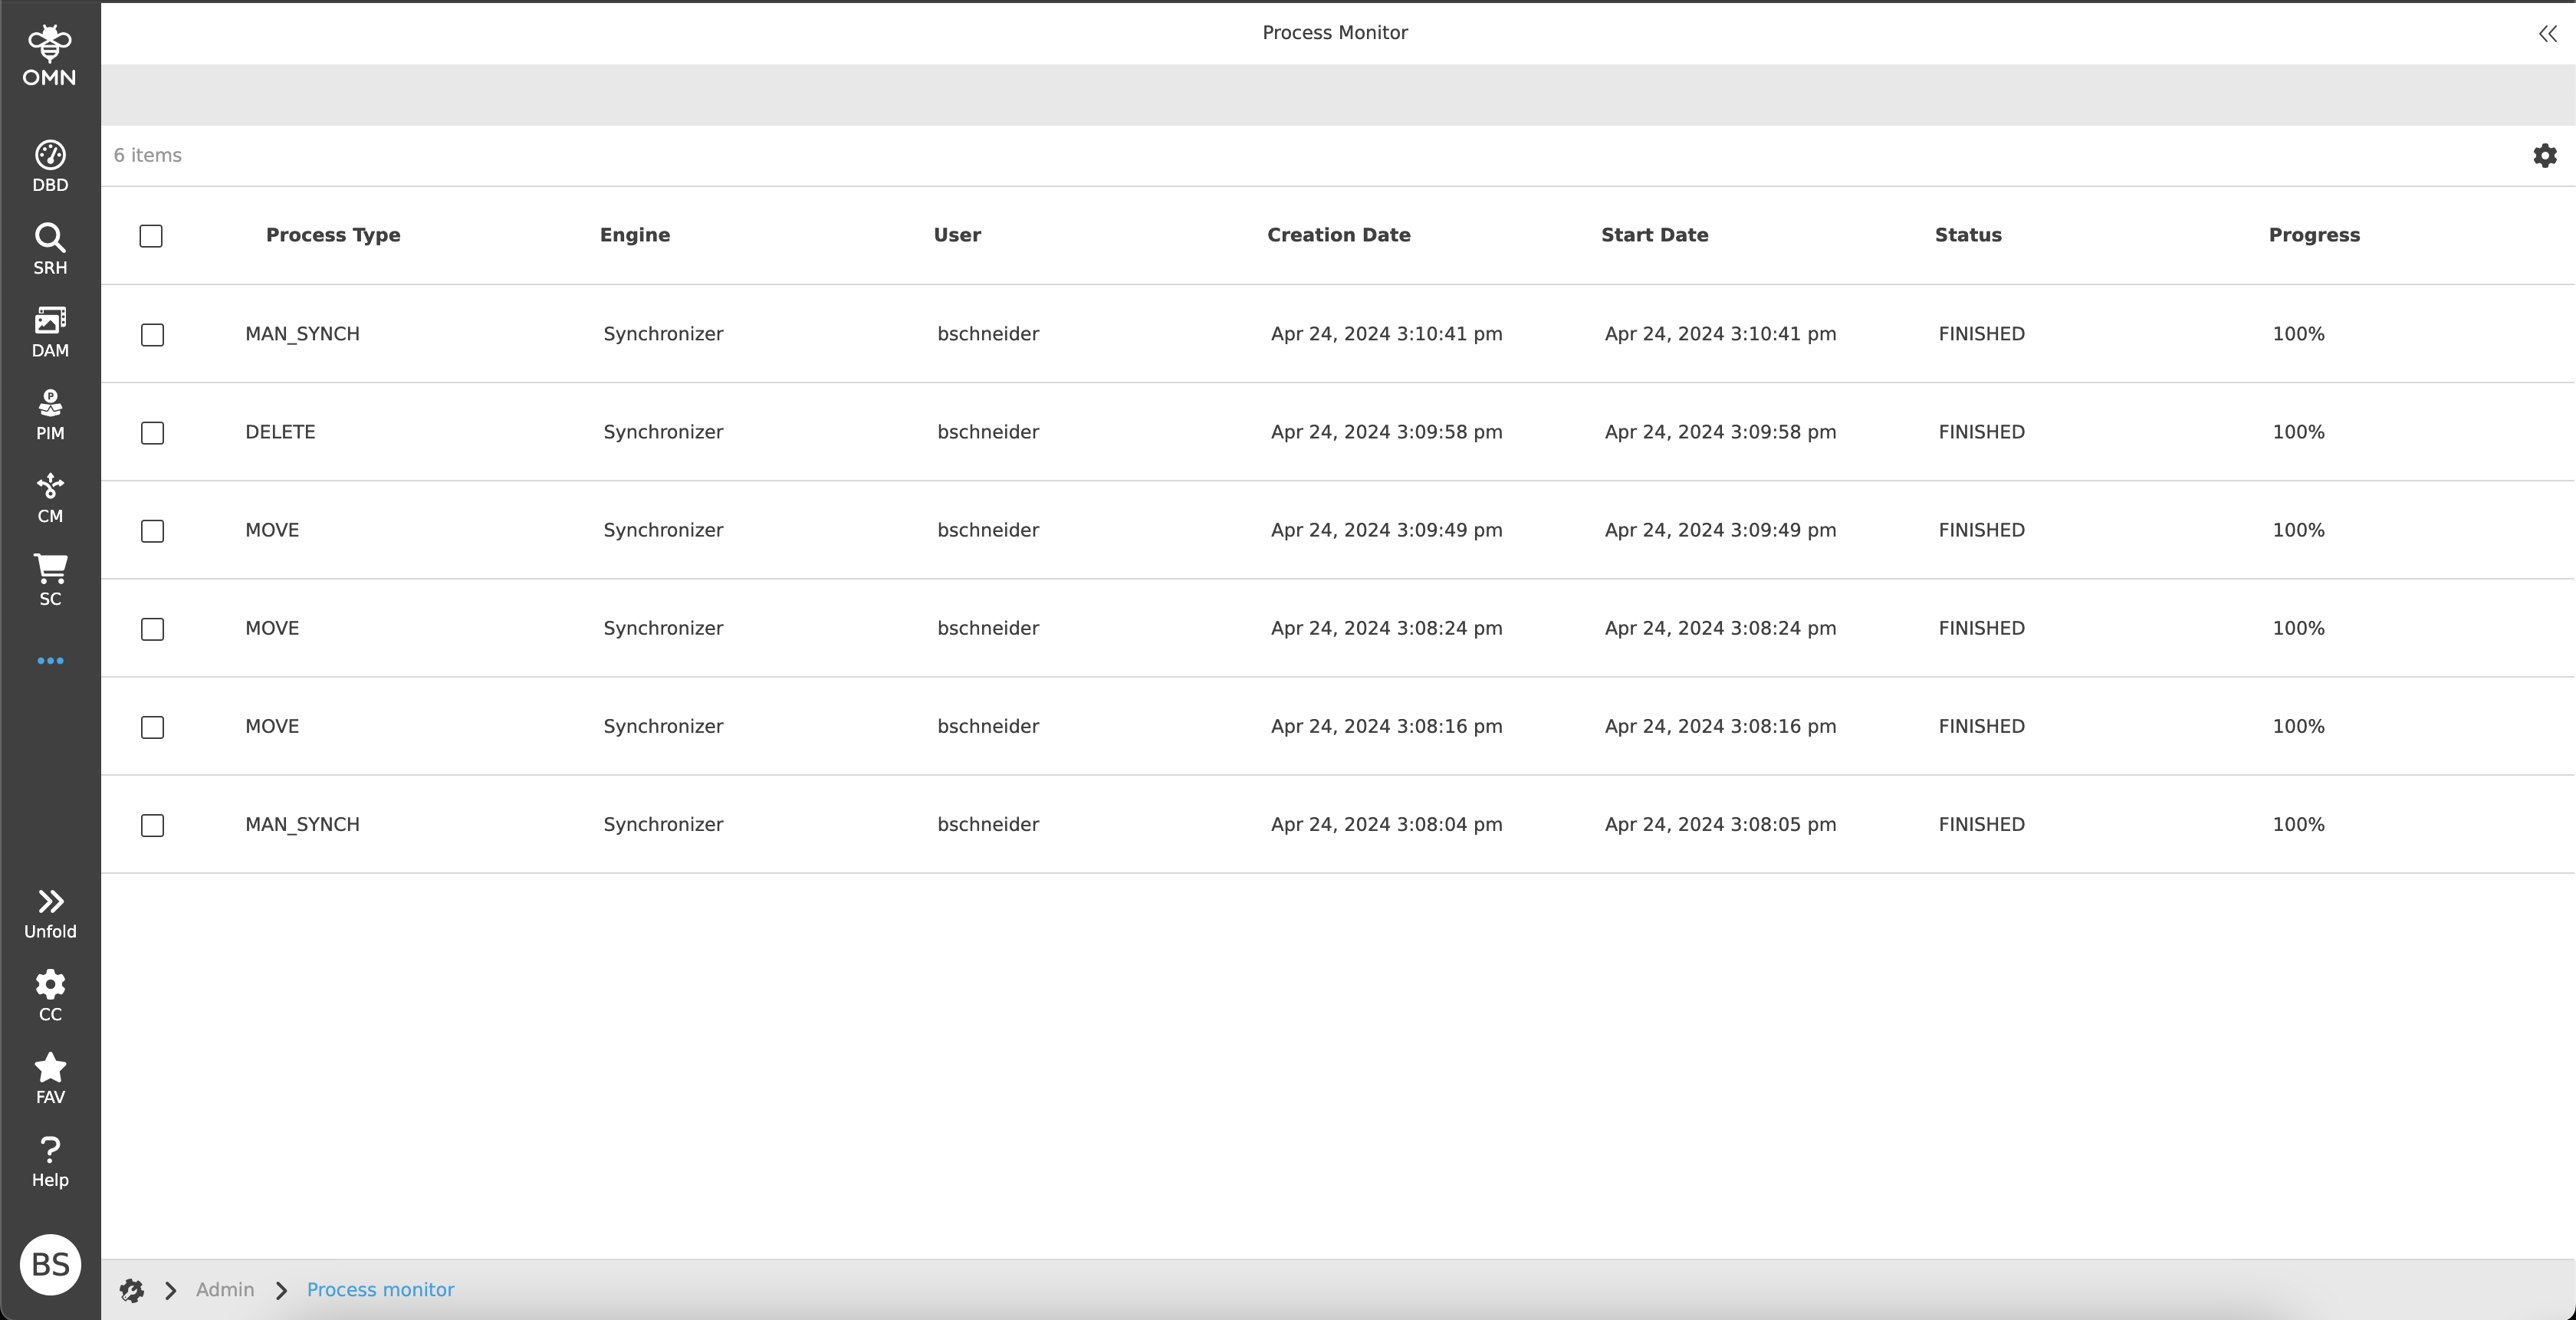
Canvas
The workspace shows a table with running or completed processes.
Standard columns are initially displayed in the table as soon as the module is opened.
The standard columns are:
-
Process Type
-
Engine
-
User
-
Creation Date
-
Start Date
-
Status
-
Progress
There are also additional columns that can be added via the statusbar settings:
-
Foreign Key
-
Current File
-
Done Files
-
Done Files Sizes
-
Finish Date
-
Overall Files
-
Overall Files Size
-
Overall Directories
-
Done Directories
-
Owner
-
Path
-
Priority
-
RNC Identifier
-
Mandator Identifier
| Depending on the backend settings, it is possible that only own processes or all processes are displayed. |
Right View
If a process is selected, the process-relevant information is displayed in the right view.
The right view consists of three accordions with the following attributes:
-
Runtime Information
-
Creation Time
-
Start Time
-
Finish Time
-
Status
-
Runtime
-
Progress
-
Total Number Of Files
-
Processed Files
-
Last Processed File
-
-
Process Information
-
Process ID
-
Process Type
-
User
-
Job
-
Root Node
-
Path
-
-
Process Properties
-
Shows various properties that are dependent on the respective process.
-