OMN Dashboard
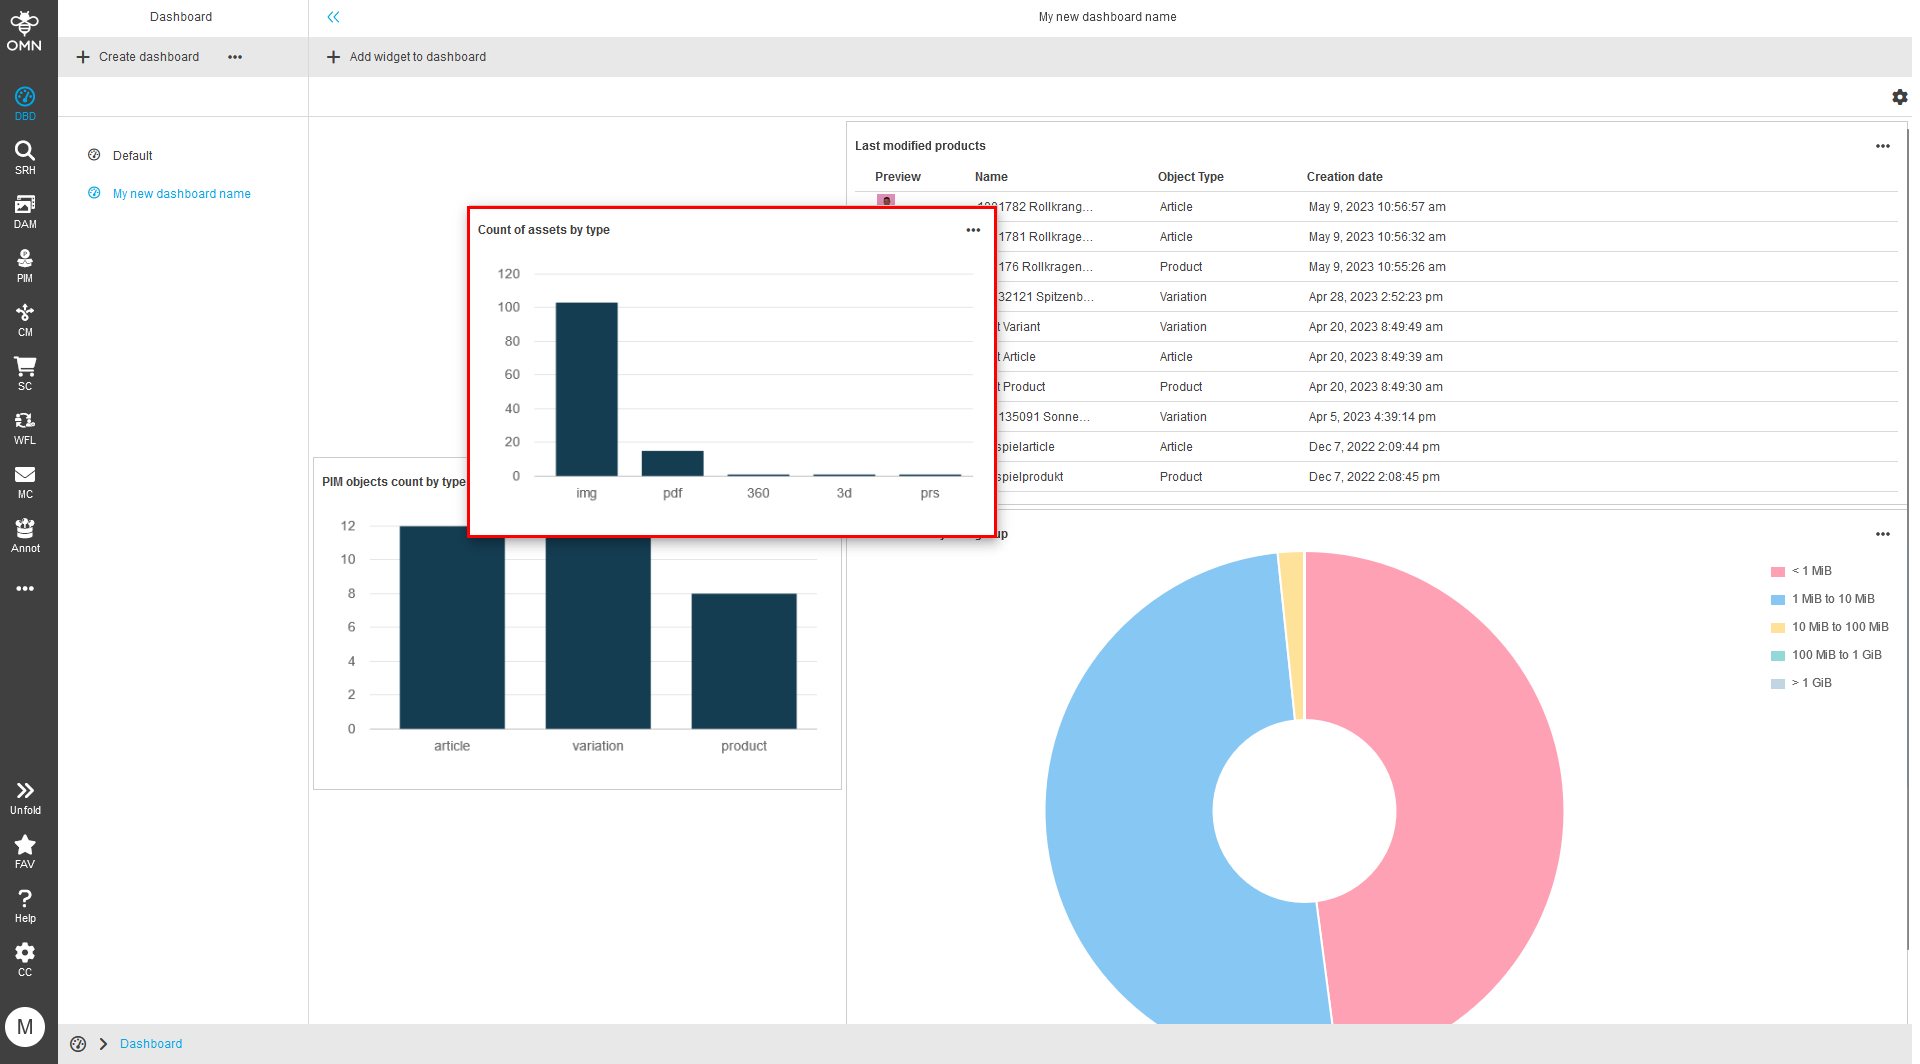
The OMN Dashboard is a flexible and configurable start page within OMN. Every user (with the appropriate rights) can set up their own personal dashboards. For this purpose, the user can choose different layouts and widgets. The widgets can be placed free within the layout and configured as desired.
Basics and Principles
The dashboard is an OMN module that can visualize data from the OMN search index in various widgets.
It only visualizes data within a single entity, such as DAM, PIM or CM.
Users create their own dashboards based on widgets, and the dashboards and widgets are stored on a user-specific basis.
There is no central administration of dashboards.
However, since version OMN 6.4, dashboards can be shared between users as references or copies (see chapter Share dashboard).
The currently available widgets are defined by the product.
| If there are any requests for extensions, please contact the support team. |
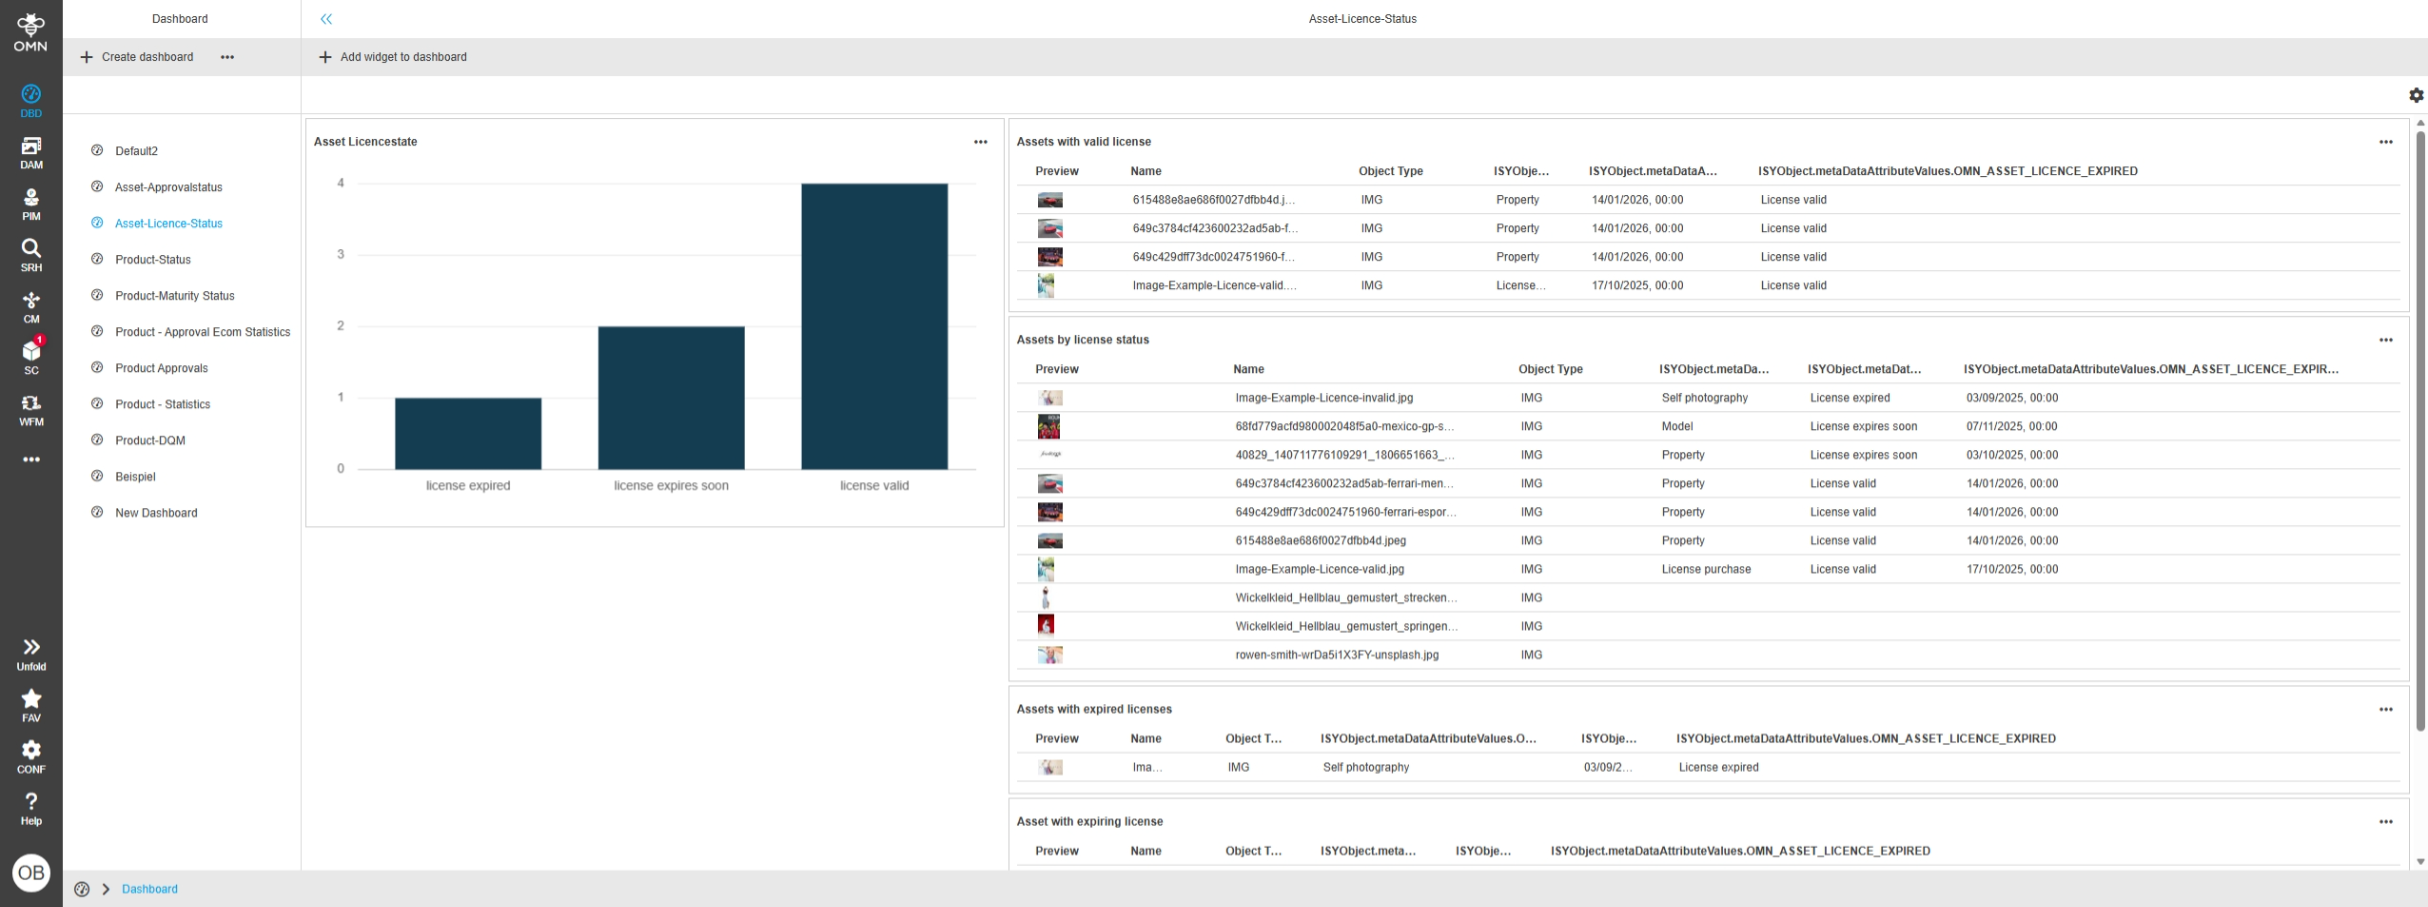
Enum attributes are suitable for visualizing data in dashboards, as they allow grouping (e.g., display by status).
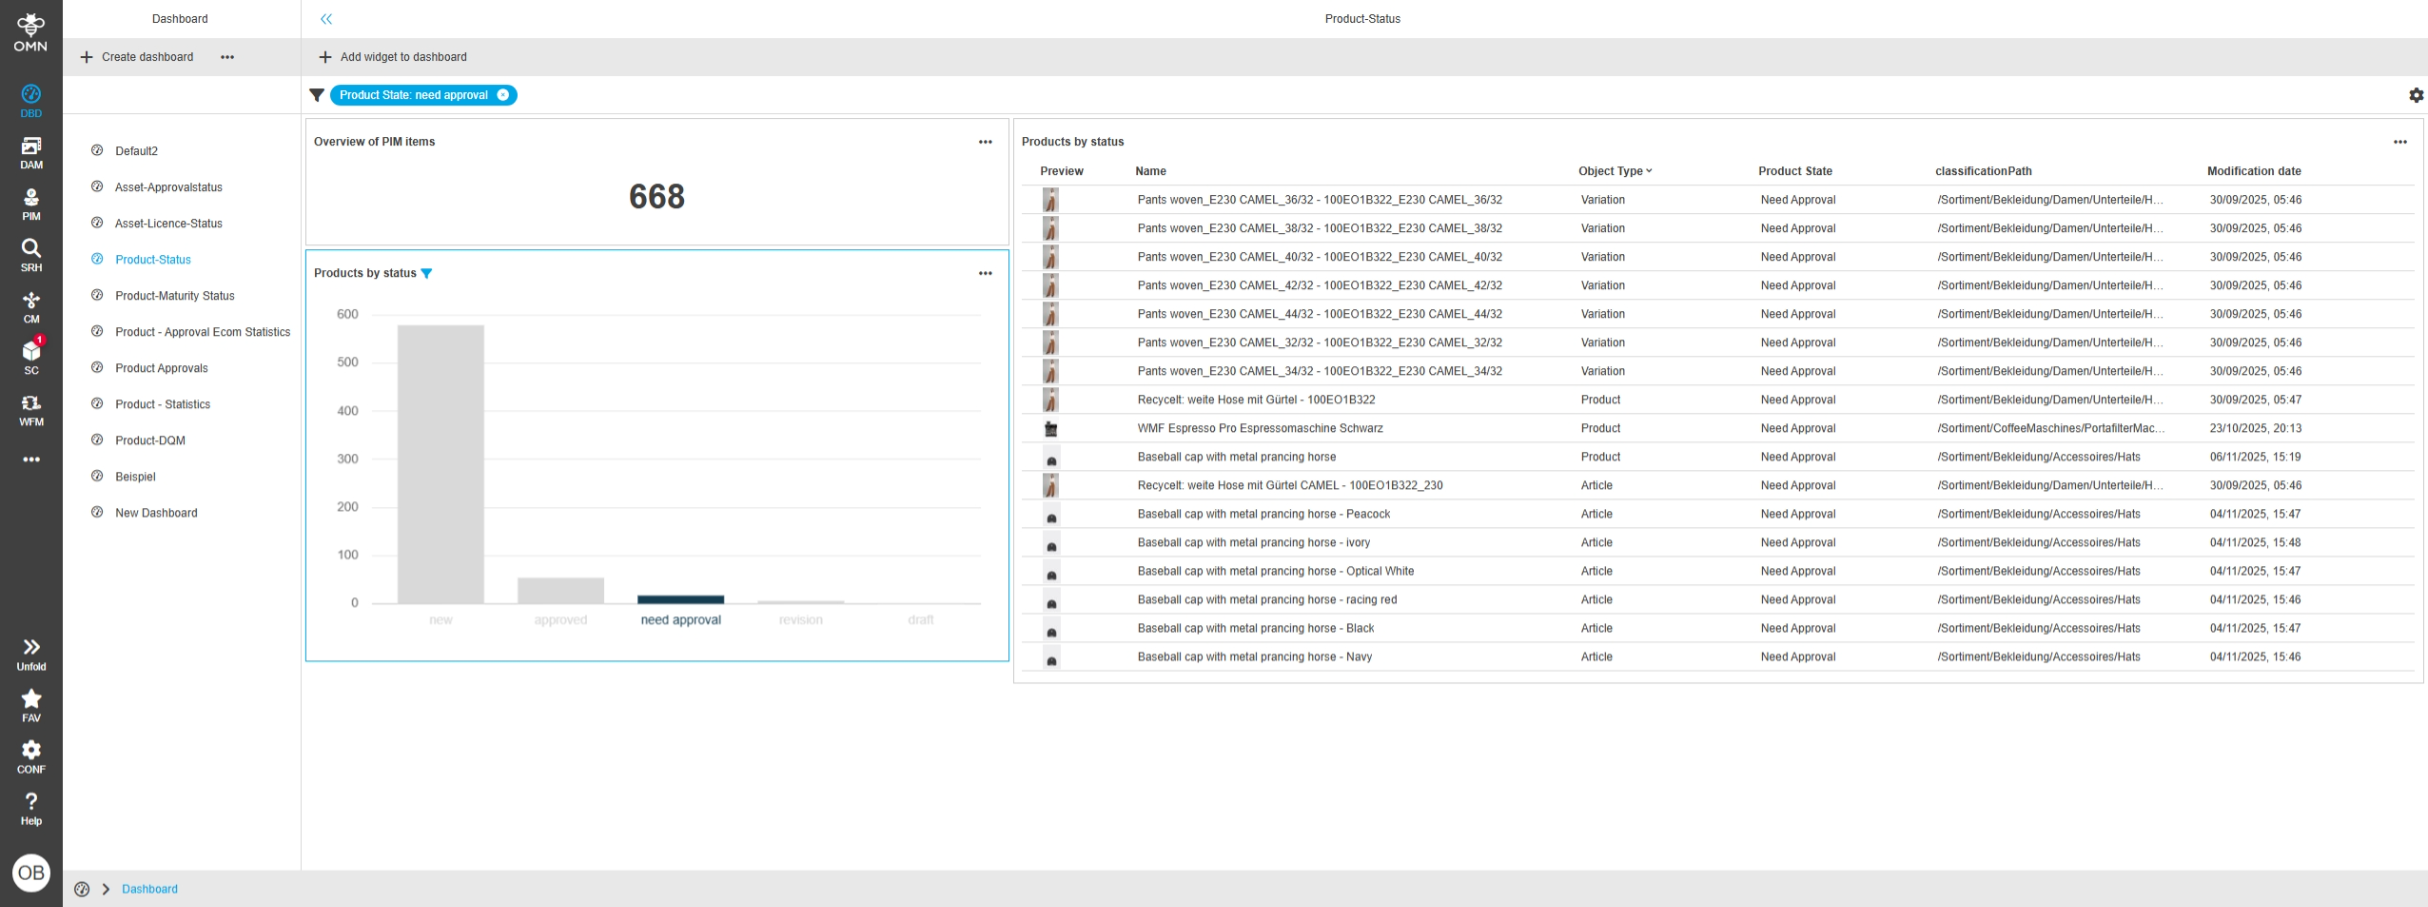
Some widgets allow interaction with another widget or module.
For example, filters in a pie chart widget can affect a table widget.
It is also possible to jump from a dashboard entry displayed within a configured widget to a specific data record.
Working with the dashboard
Create a dashboard
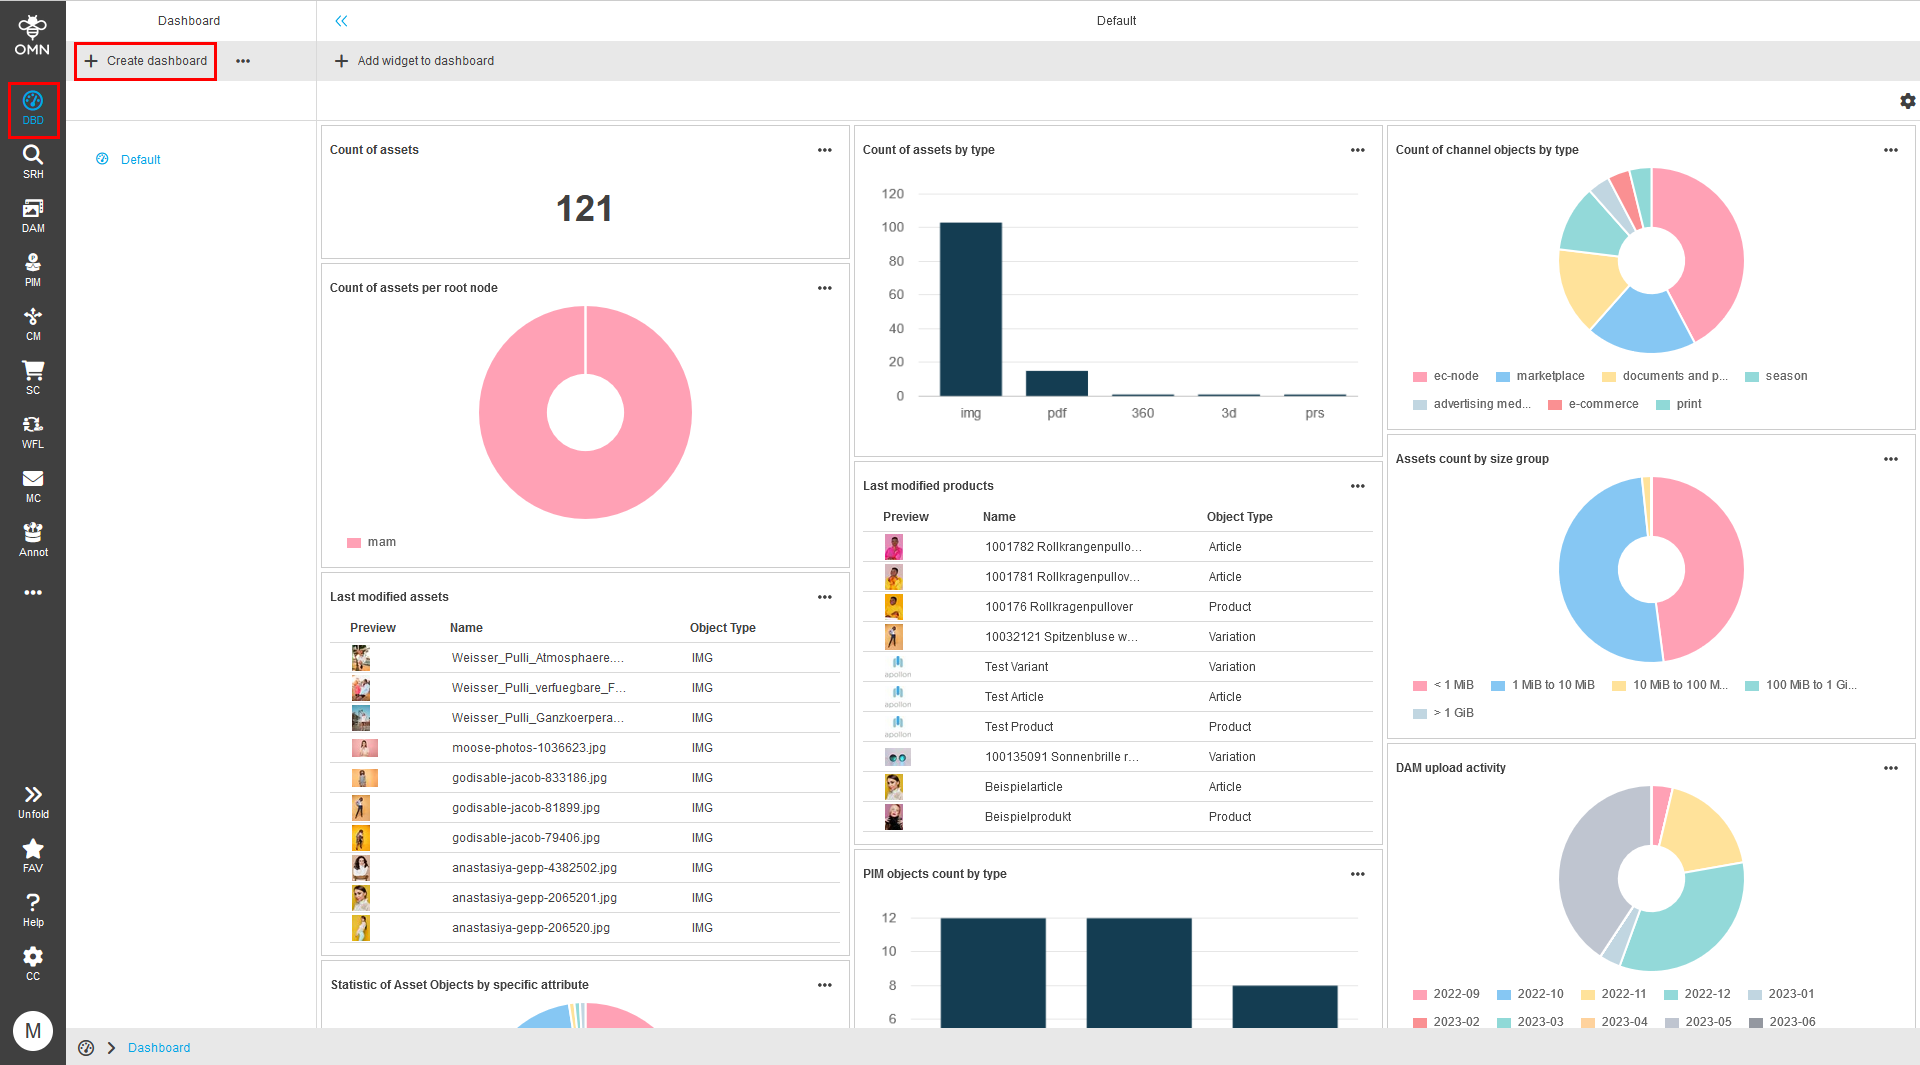
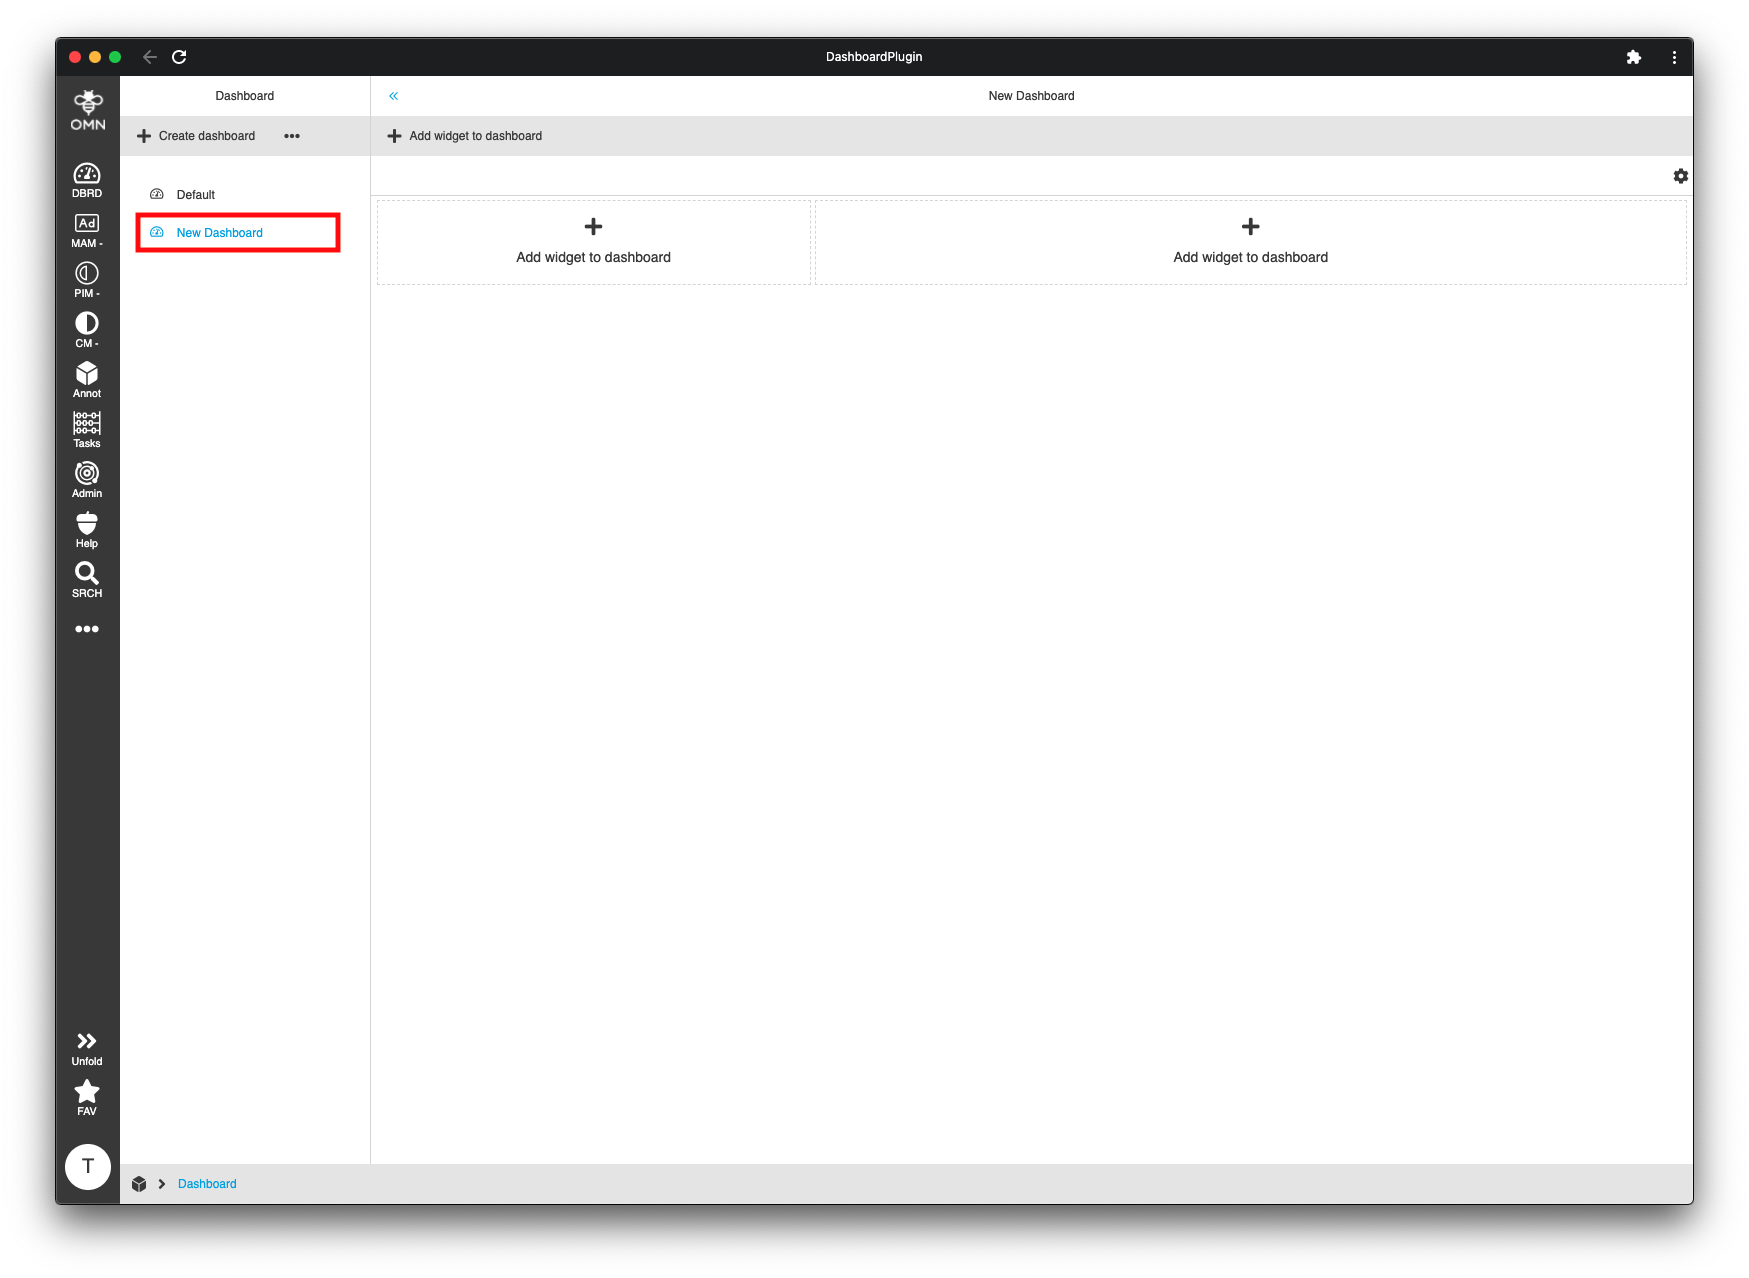
To create a new dashboard make sure to navigate to the dashboards using the main menus "DBRD" icon.
After activating the dashboard area you can simple create a new dashboard using the "Create dashboard" button.
In the following dialog please select the desired layout of your new dashboard and give it a name.
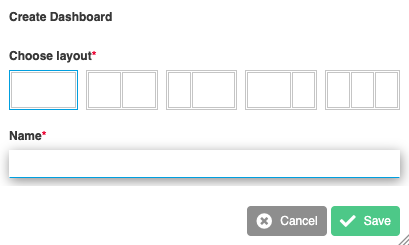
Accept your selection by clicking the "Save" button. Your new dashboard will be automatically activated. You will also find it in the left navigation panel where you can switch between all your dashboards.
Add widgets to a dashboard
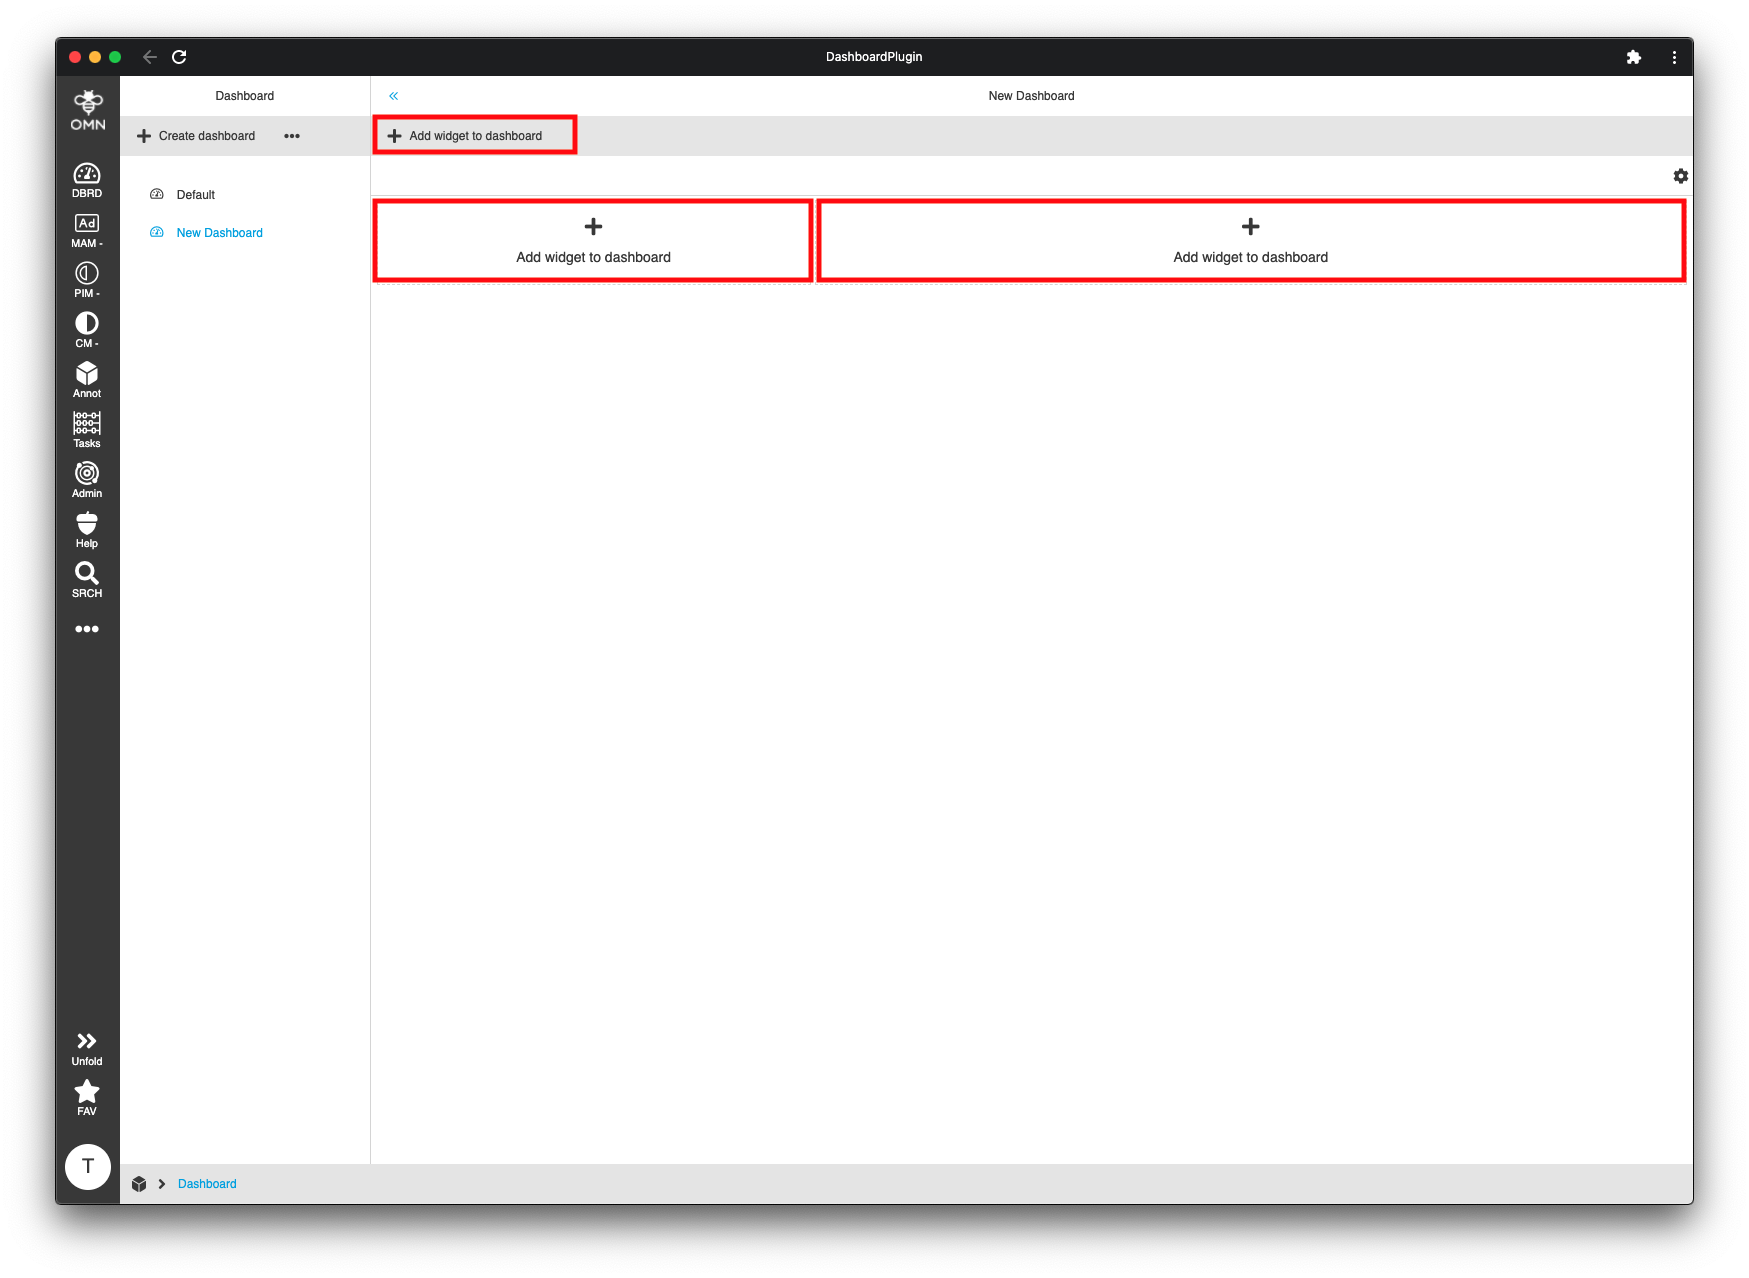
To add a widget to a dashboard you have several options. Either by clicking the "Add widget to dashboard" button at the top of the dashboard or by clicking the "Add widget to dashboard" area inside the columns.
A new dialog will appear where you can select the widget which should be added to the dashboard.
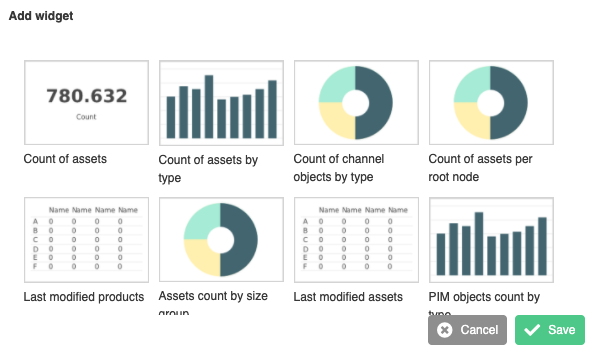
Select the desired widget and click on the "Save" button.
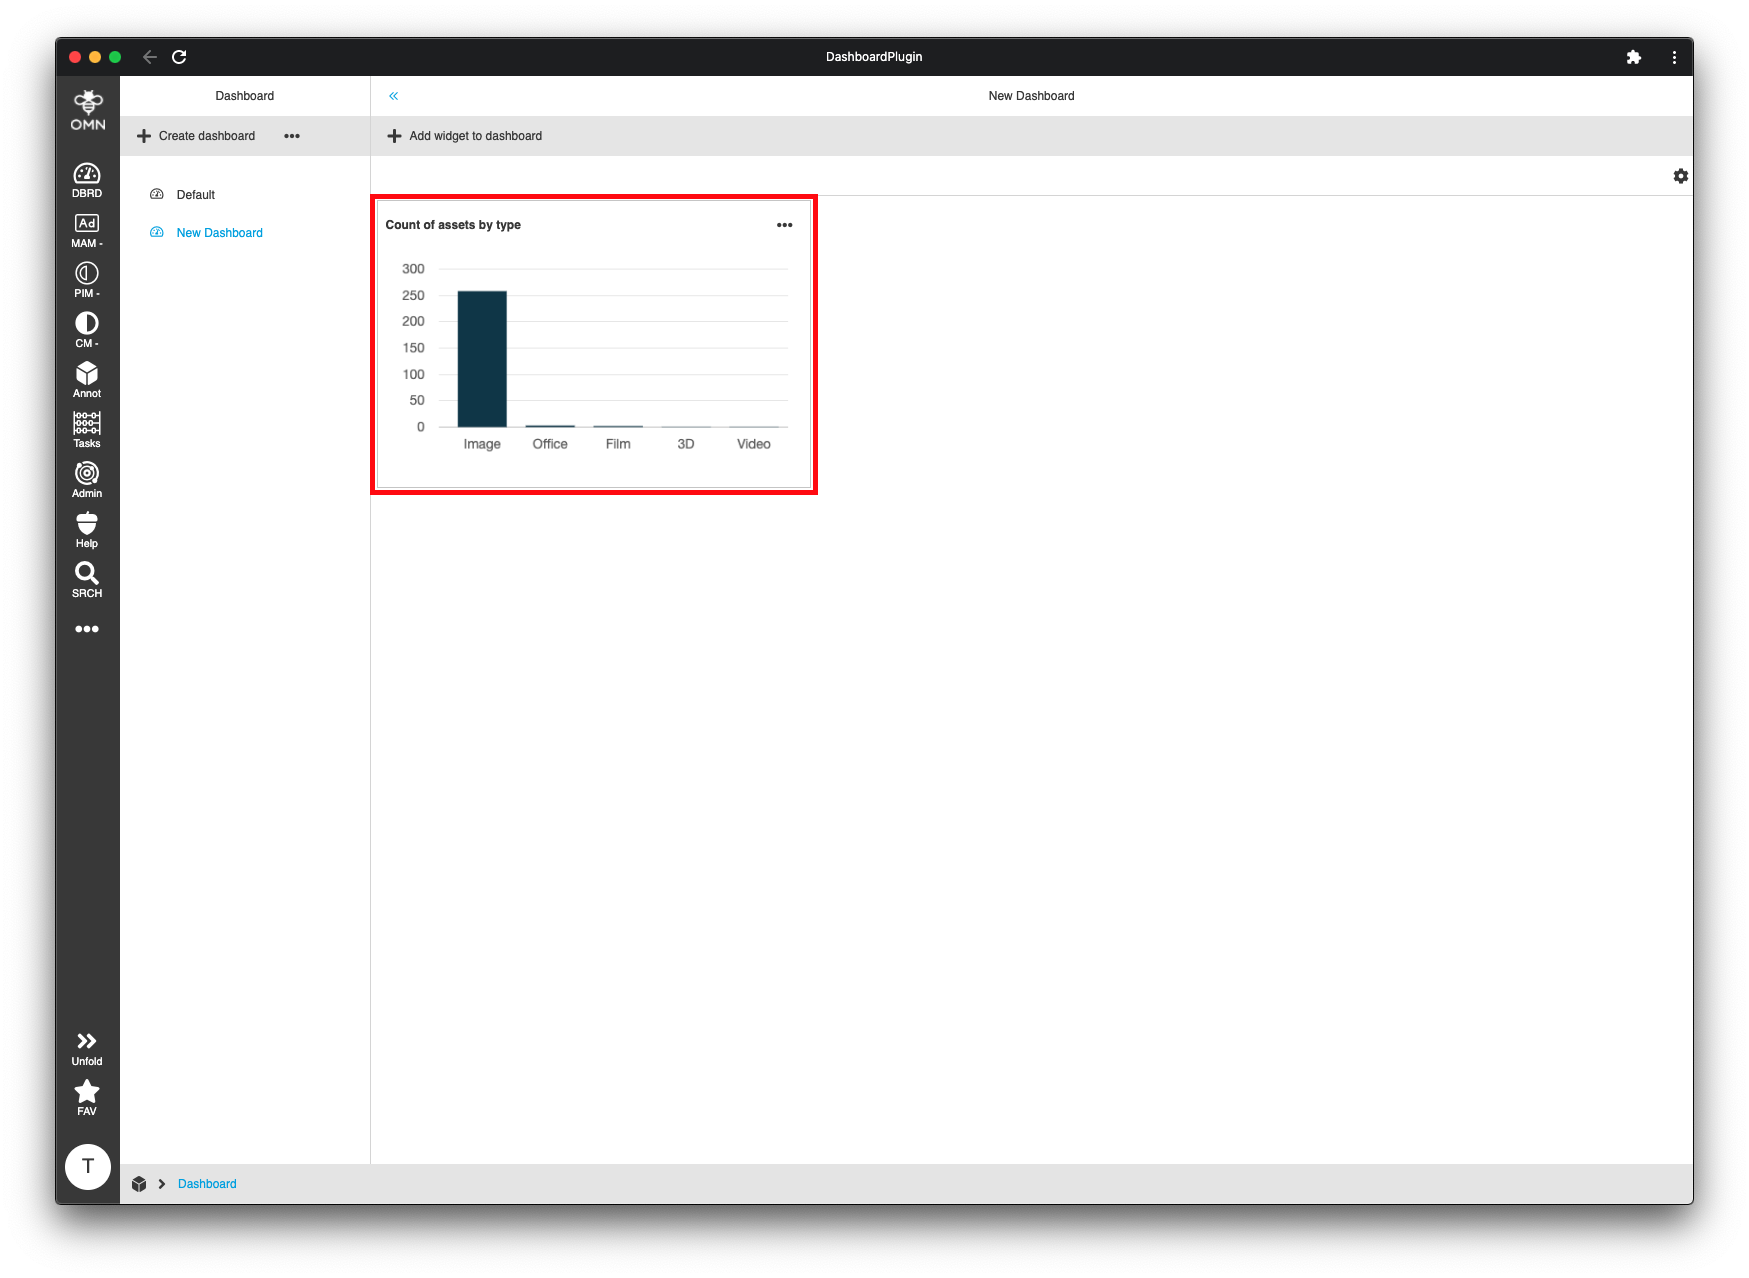
The widget will then be added to the dashboard. Repeat these steps to add more widgets.
Move widgets within the dashboard layout
To move a widget, which has already been added to a dashboard column, simple drag and drop it to your desired location.
When dragging the widget around, you will notice that the other widgets free up some space where you can drop the widget. Release the mouse button and the widget will take its place at the new location.
Configure widgets
Widget can be configured by clicking the three dots in the upper right corner of the widget and selecting "Edit" in the dropdown menu.

The widget will transform to a configuration panel where you can configure the widget to fit your needs.
Depending on the widget you will have more or less options.
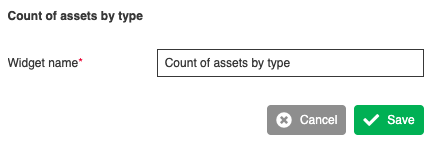
The title/name can be adjusted for every widget.
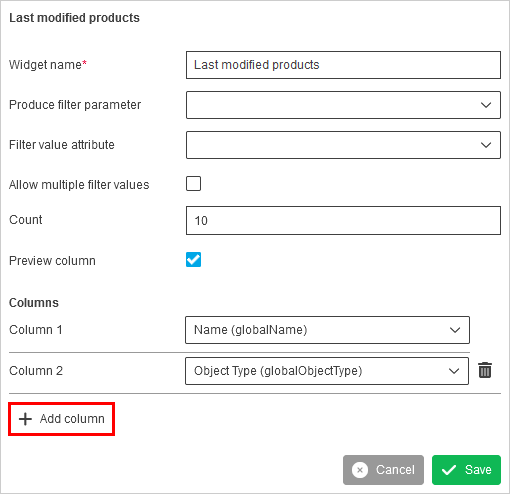
The table widget allows customizing the displayed columns. Click the "Add column" button at the bottom of the configuration panel and select the desired attribute.
Remove a widget from the dashboard
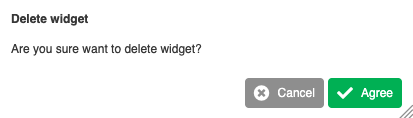
Widget can be deleted from the dashboard by clicking the three dots in the upper right corner of the widget and selecting "Delete" in the dropdown menu.

Confirm the deletion by clicking the "Agree" button in the confirmation dialog.
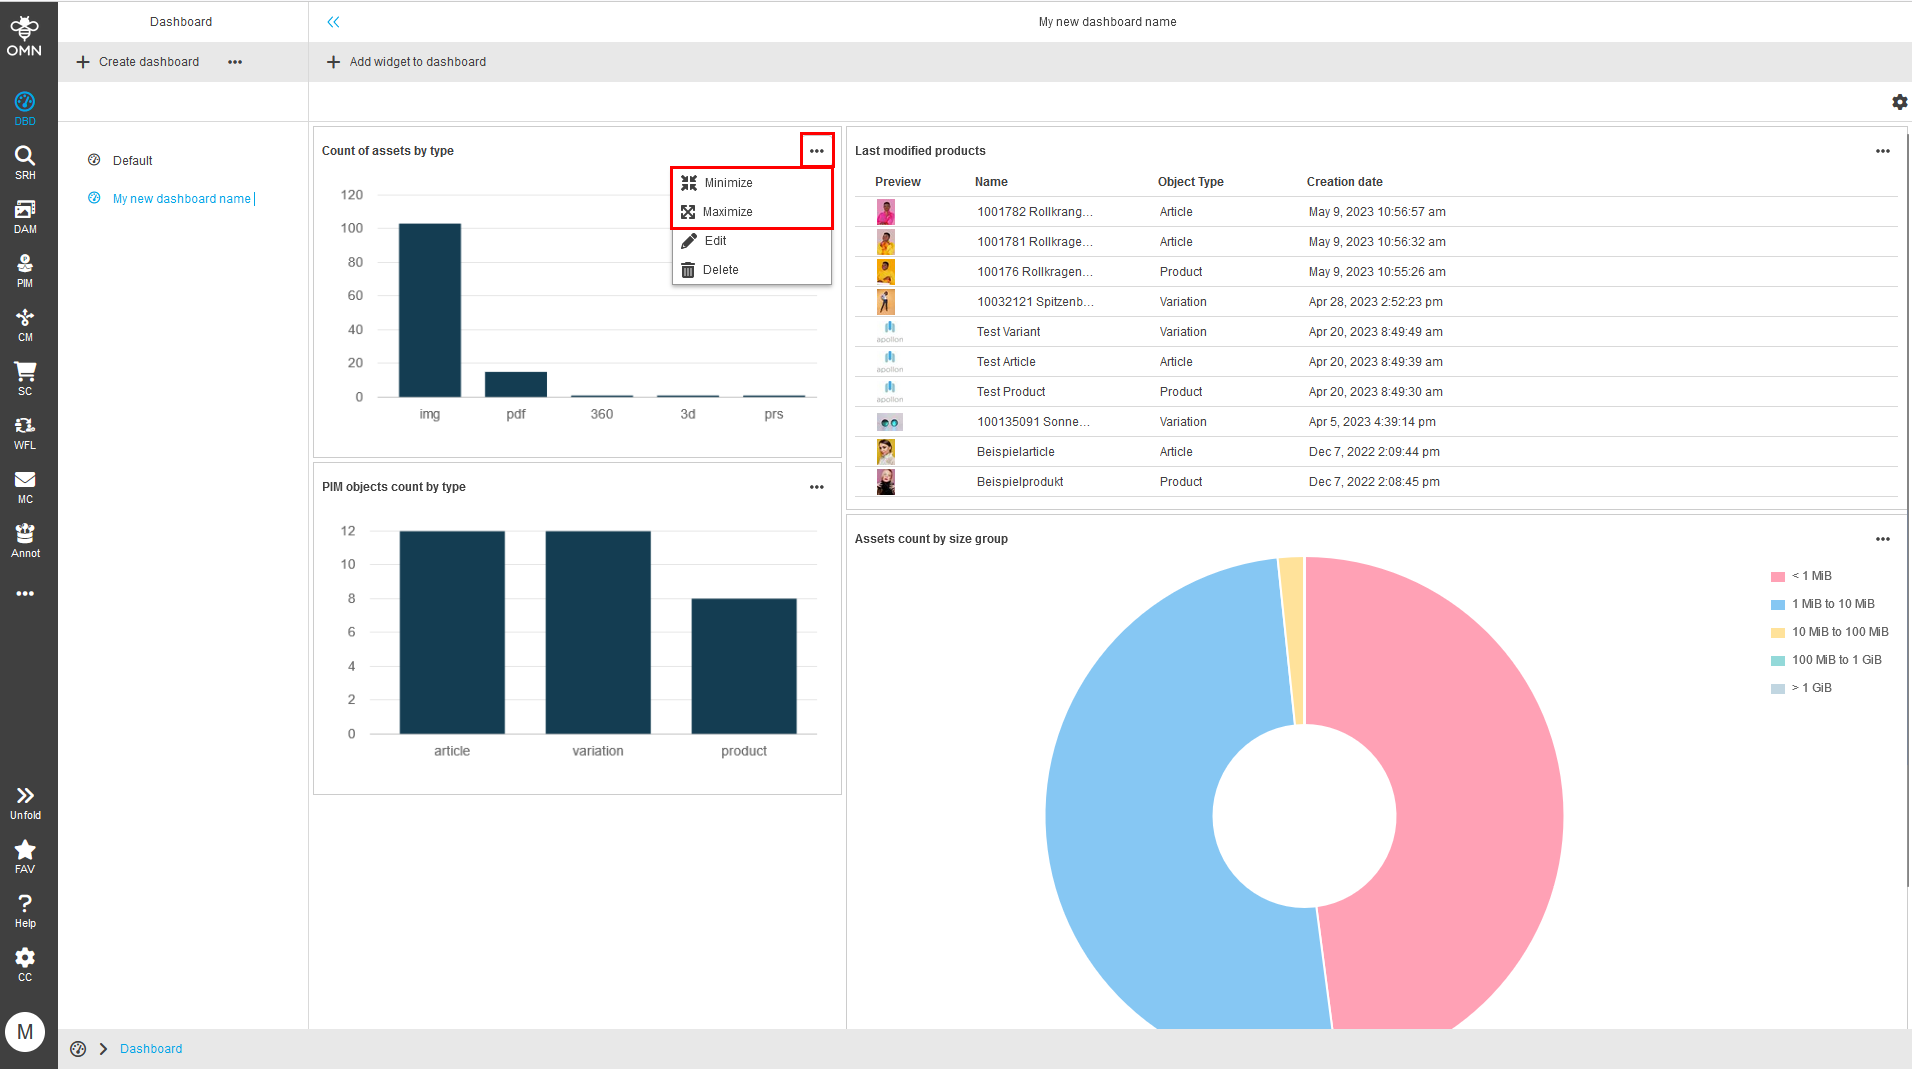
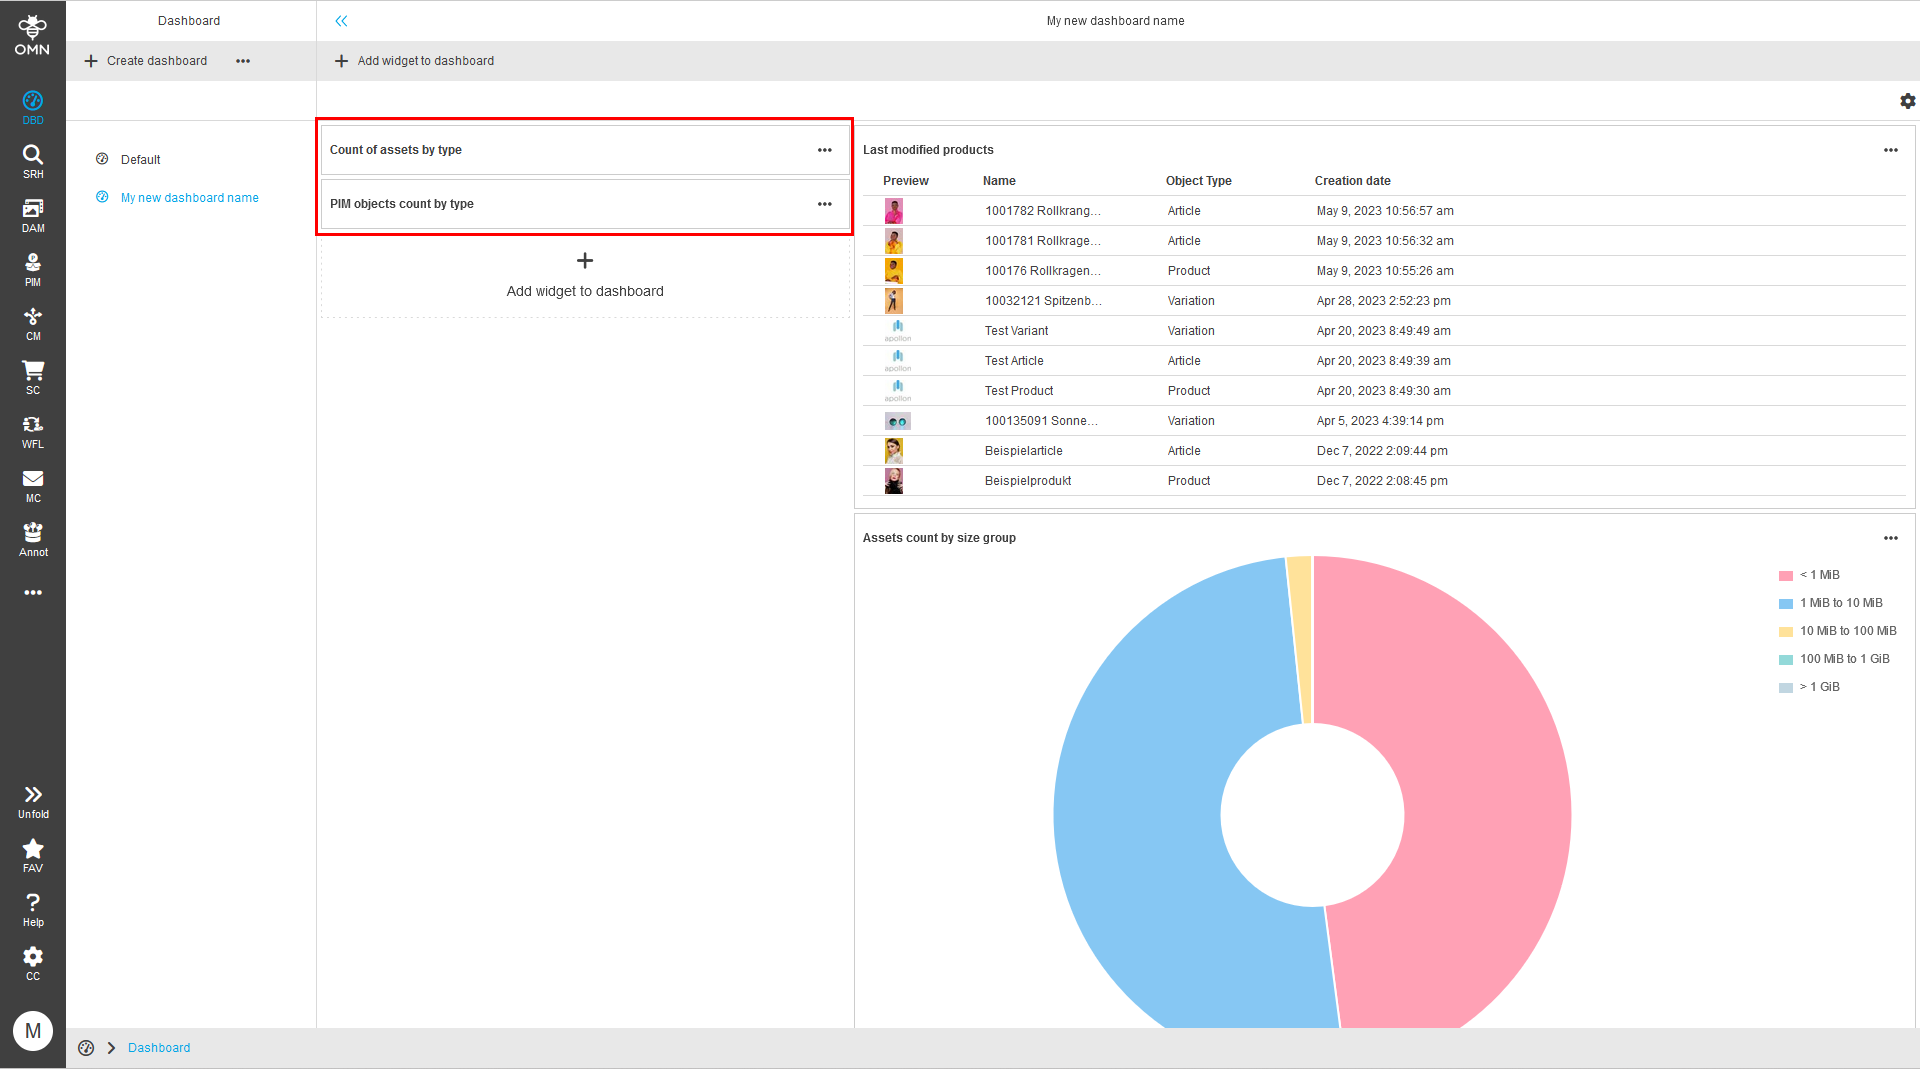
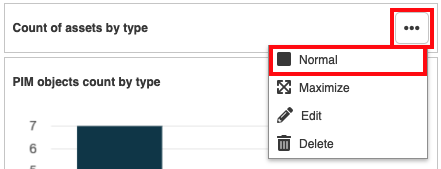
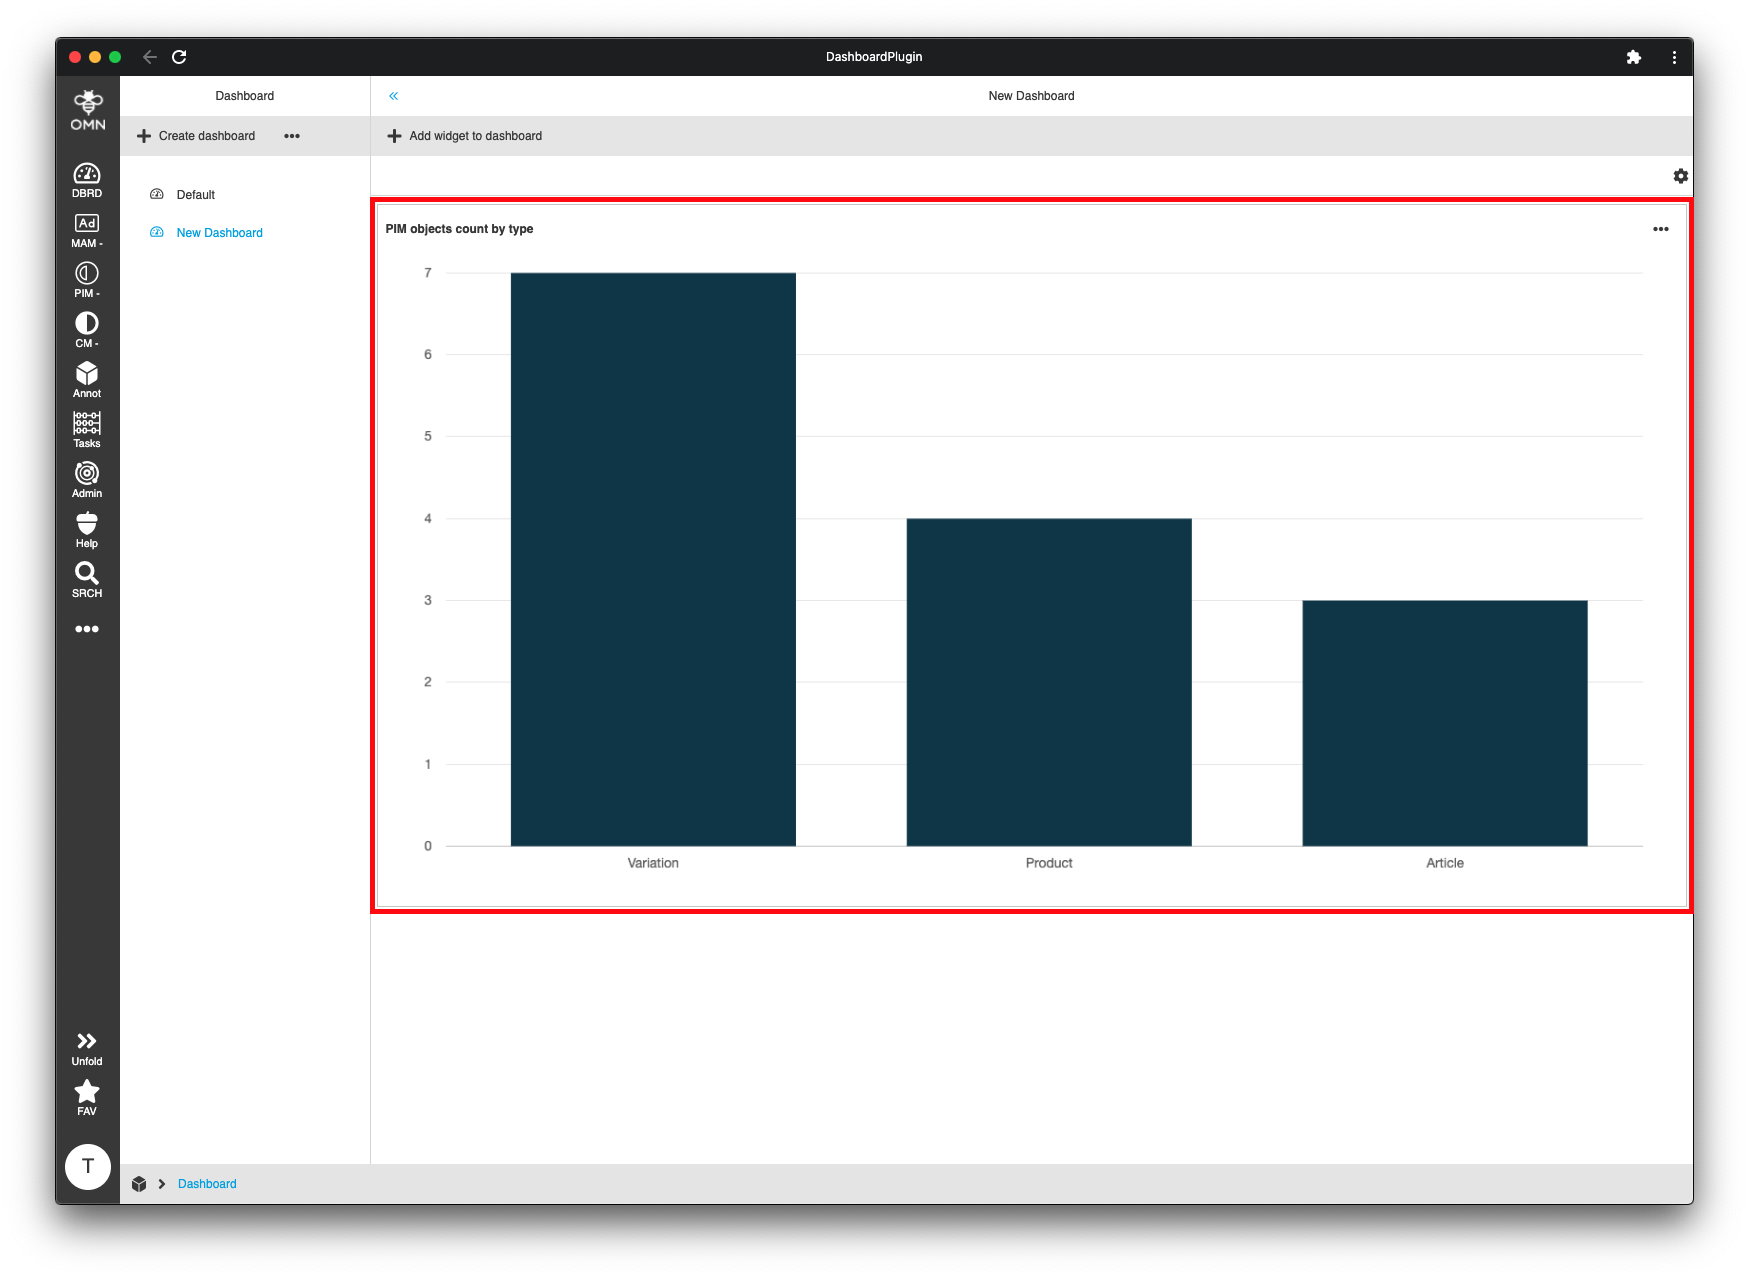
Minimize / maximize widgets
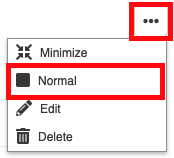
Widgets can be minimized/maximized by clicking the three dots in the upper right corner of the widget and selecting "Minimize" or "Maximize" in the dropdown menu.
Share dashboard
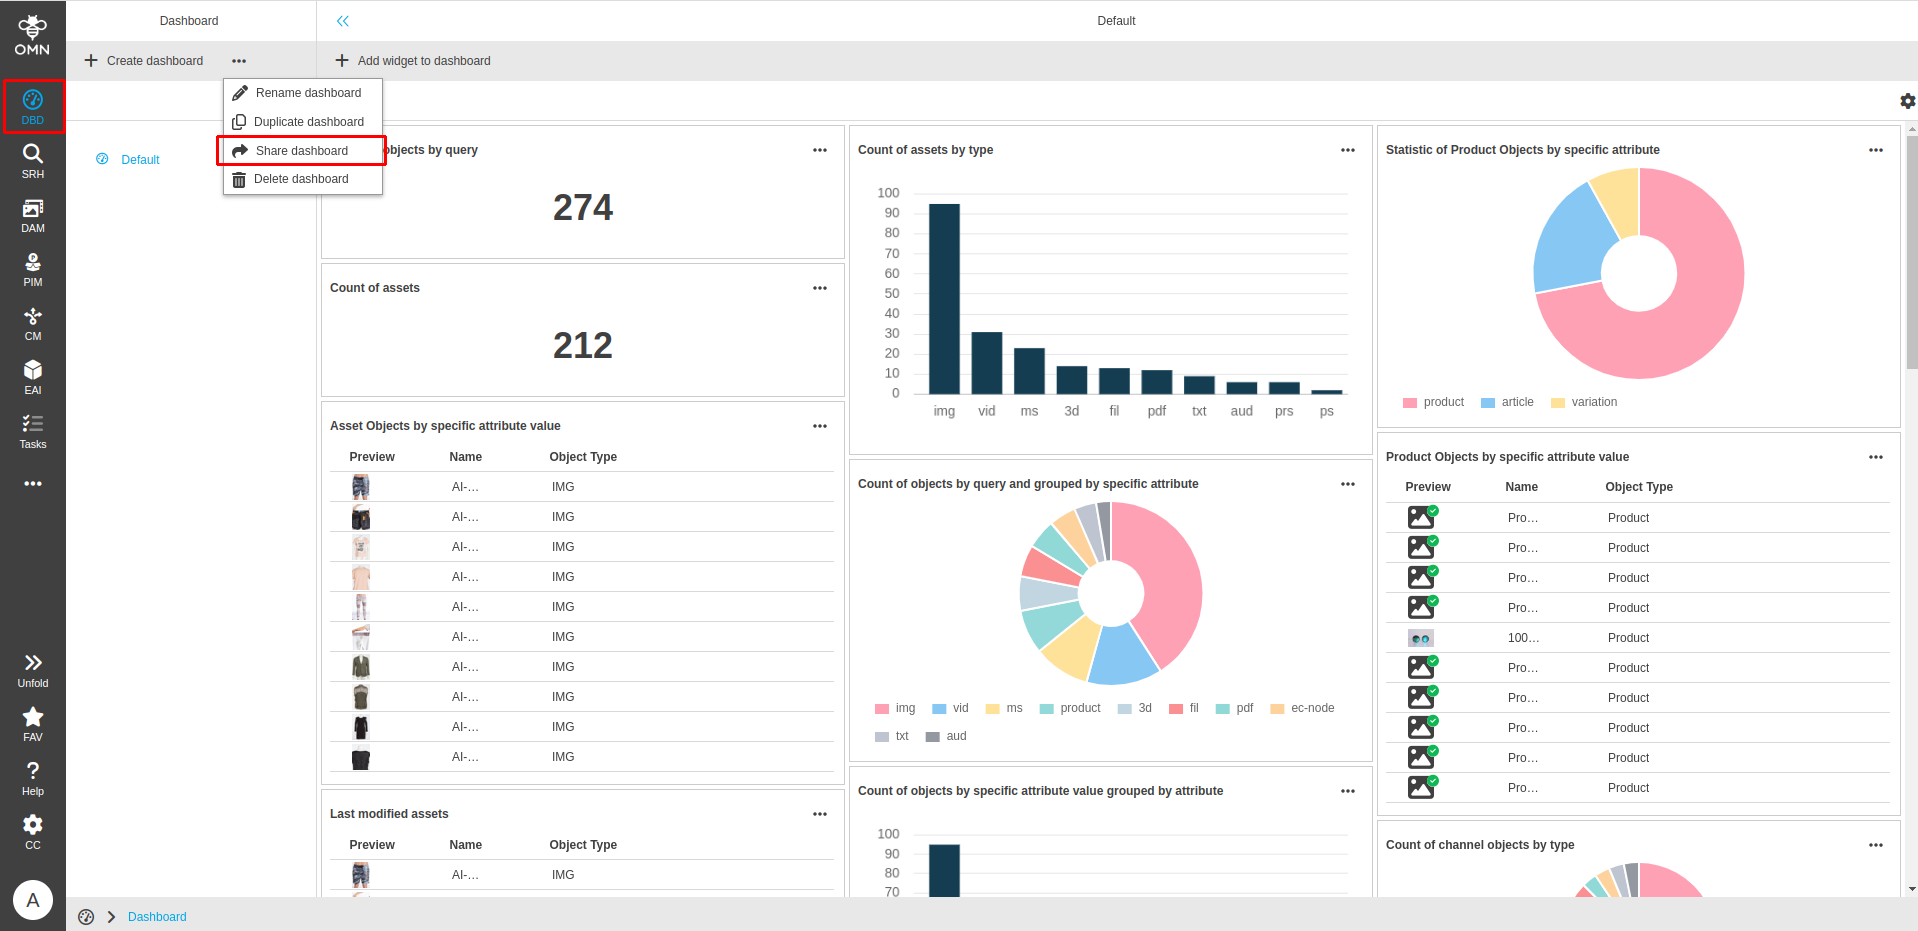
To share a created dashboard make sure to navigate to the dashboards using the main menus "DBD" icon.
After activating the dashboard area you can simply share a dashboard using the "Share dashboard" button.
In the following dialog please select the role or specific user who will receive the dashboard within "Share with" dropdown.
You can also select how to share a dashboard, as copy or reference using "Share as" radio buttons.
| When a role is selected, the users currently in the role receive the shared dashboard. If the role composition changes, the dashboard should be reshared. |
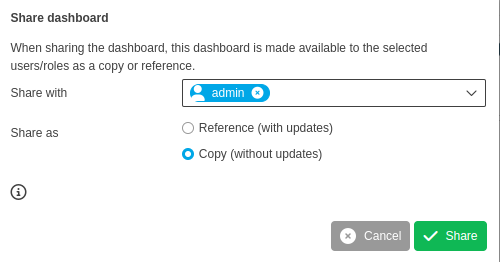
Accept your selection by clicking the "Share" button. The selected dashboard will be shared with selected user or users of selected role.
For dashboards which were shared as copy:
-
A copy can be edited by recipient independent of source dashboard.
-
A copy can be shared again.
-
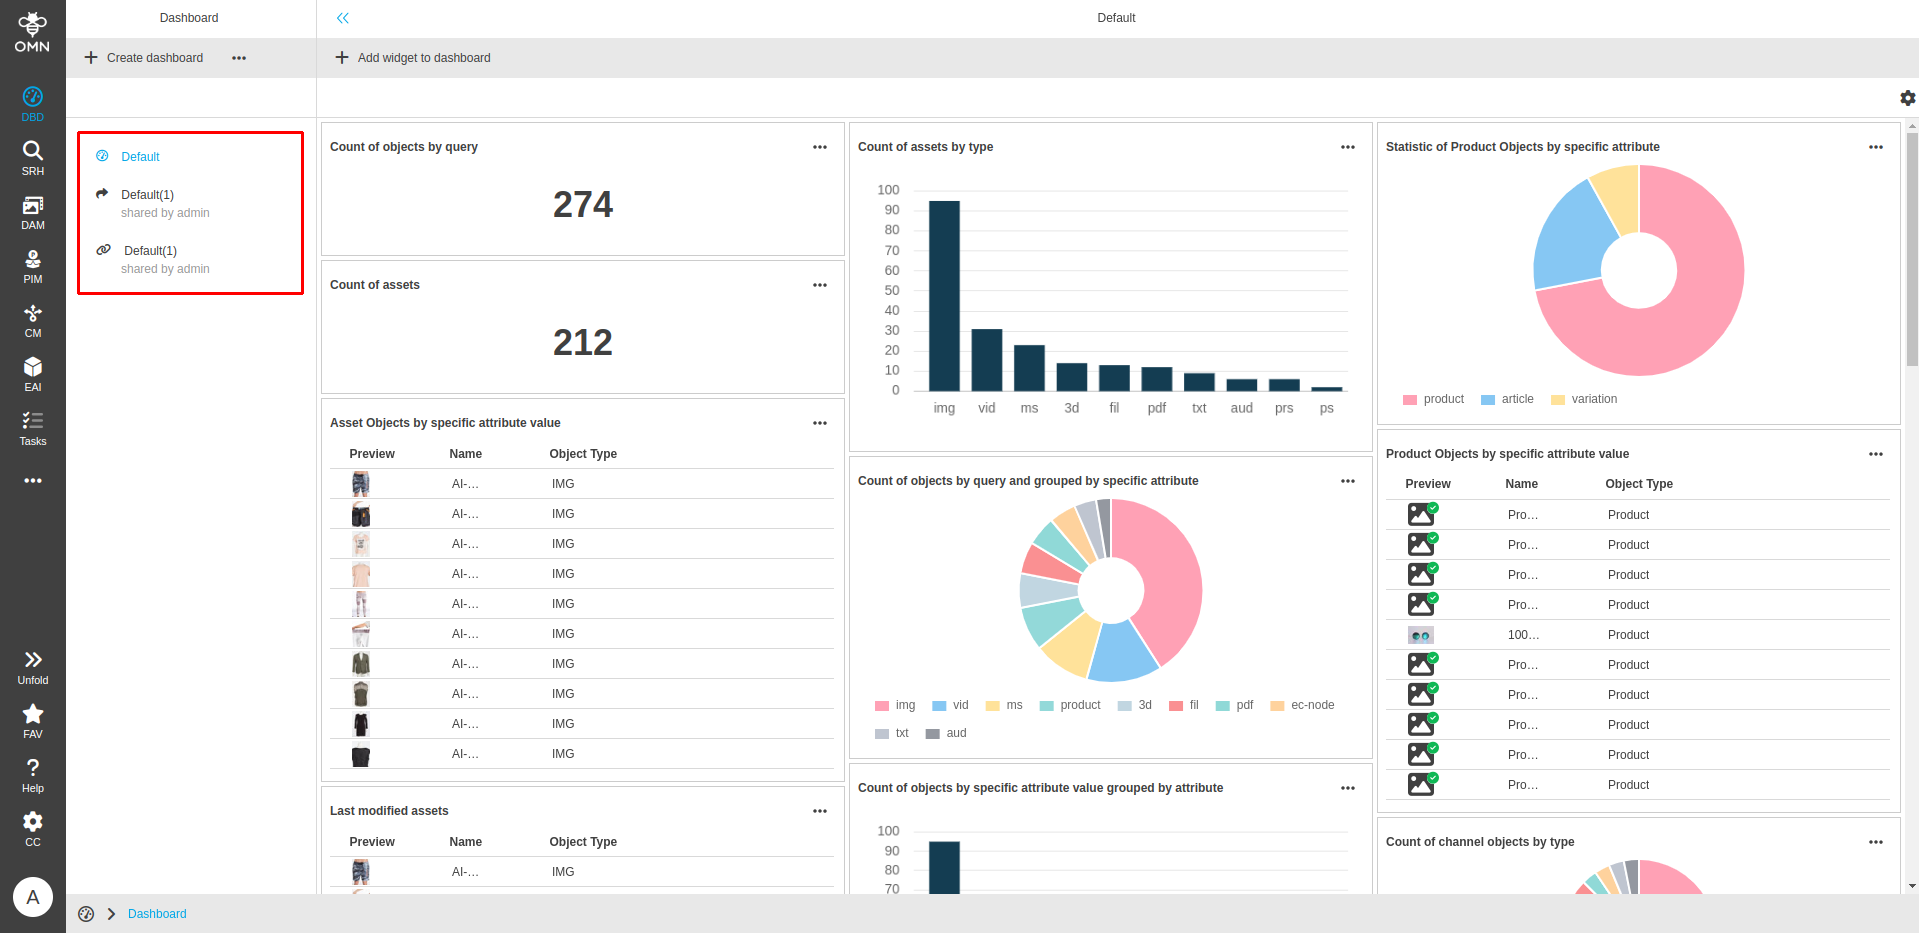
The dashboards which were shared as copy are marked with specific copy icon
 .
.
For dashboards which were shared as reference:
-
A referenced dashboard will always be connected to source and every change in source will affect all other co-users.
-
Referenced dashboards can not be changed by any co-user, only by author.
-
A dashboard shared as a reference cannot be shared by the co-users only by the author.
-
A referenced dashboard can only be shared once to the same person.
-
The dashboards which were shared as reference are marked with specific link icon
 .
.
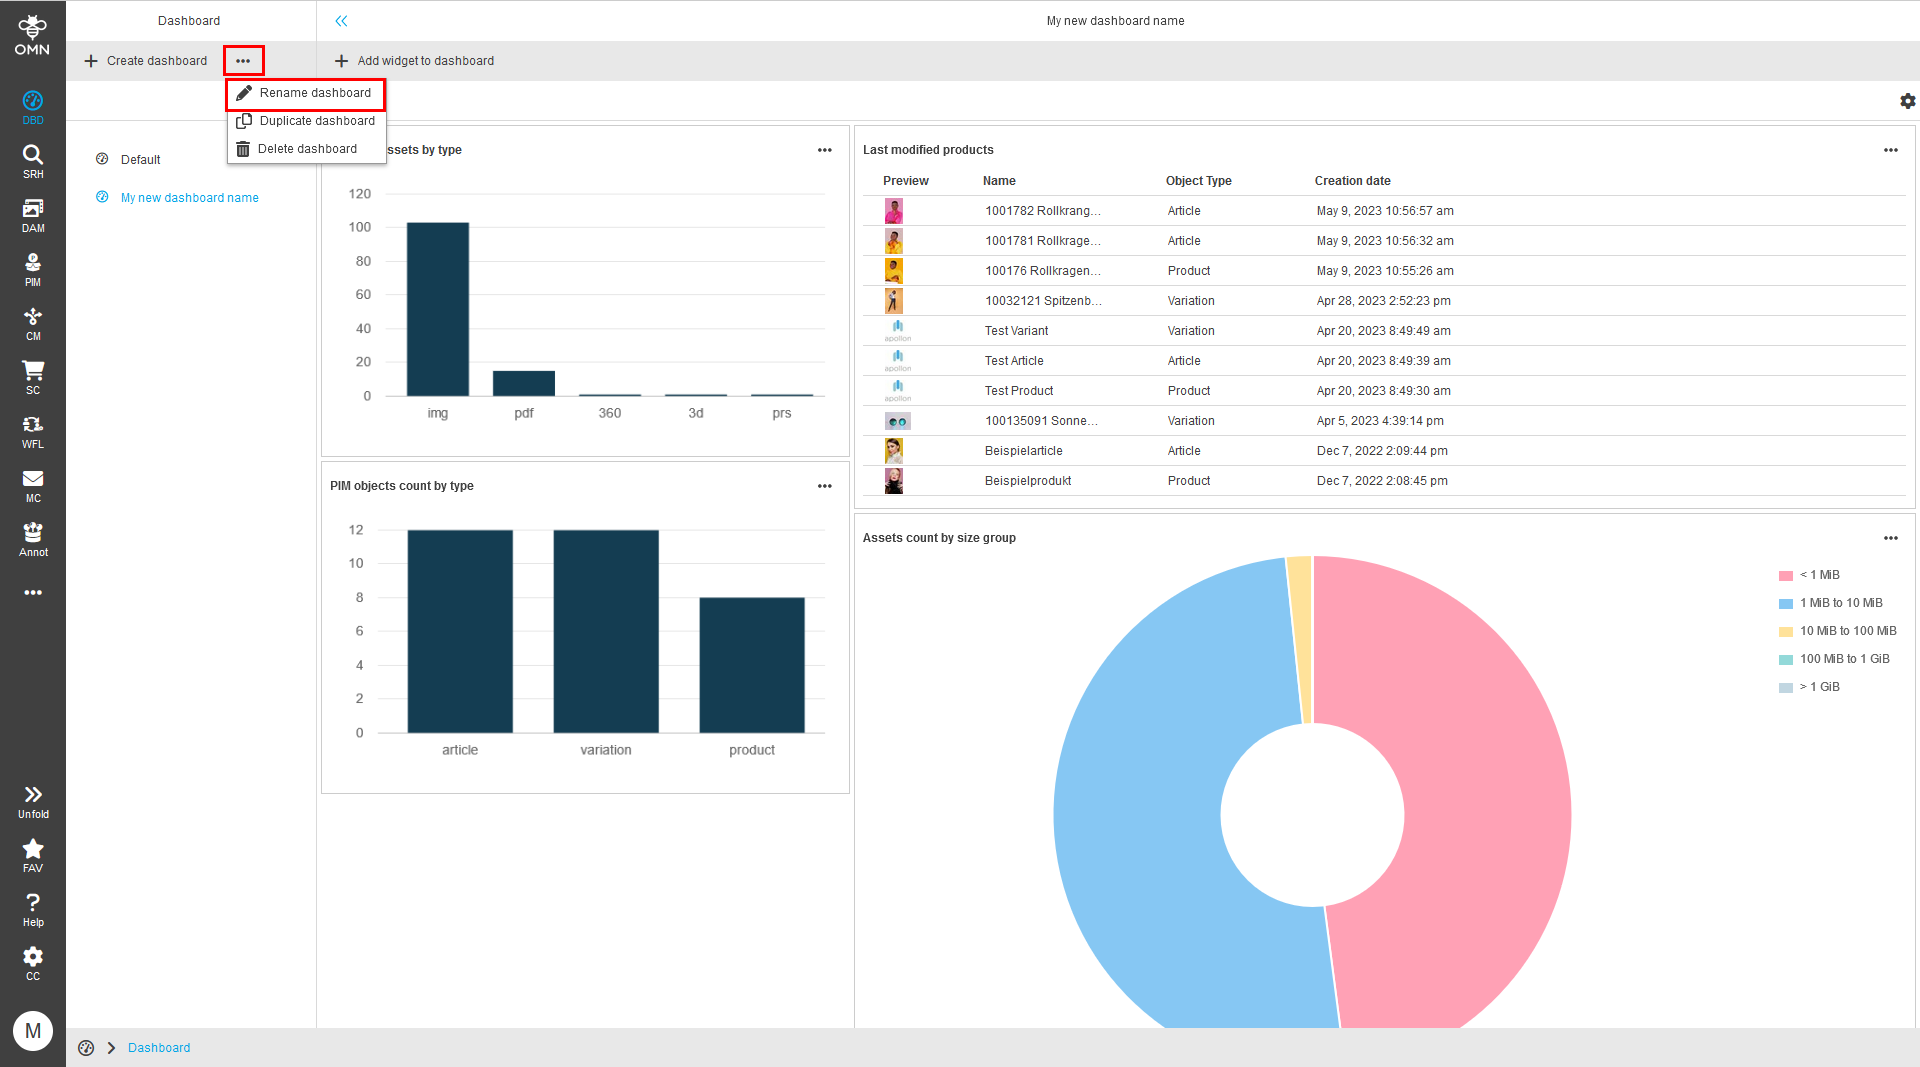
Rename a dashboard
To rename a dashboard click the three dots near the "Create dashboard" button and select "Rename" from the dropdown menu.
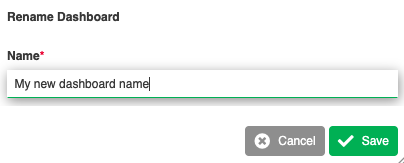
Enter the new title/name in the following dialog and click the "Save" button to confirm the change.
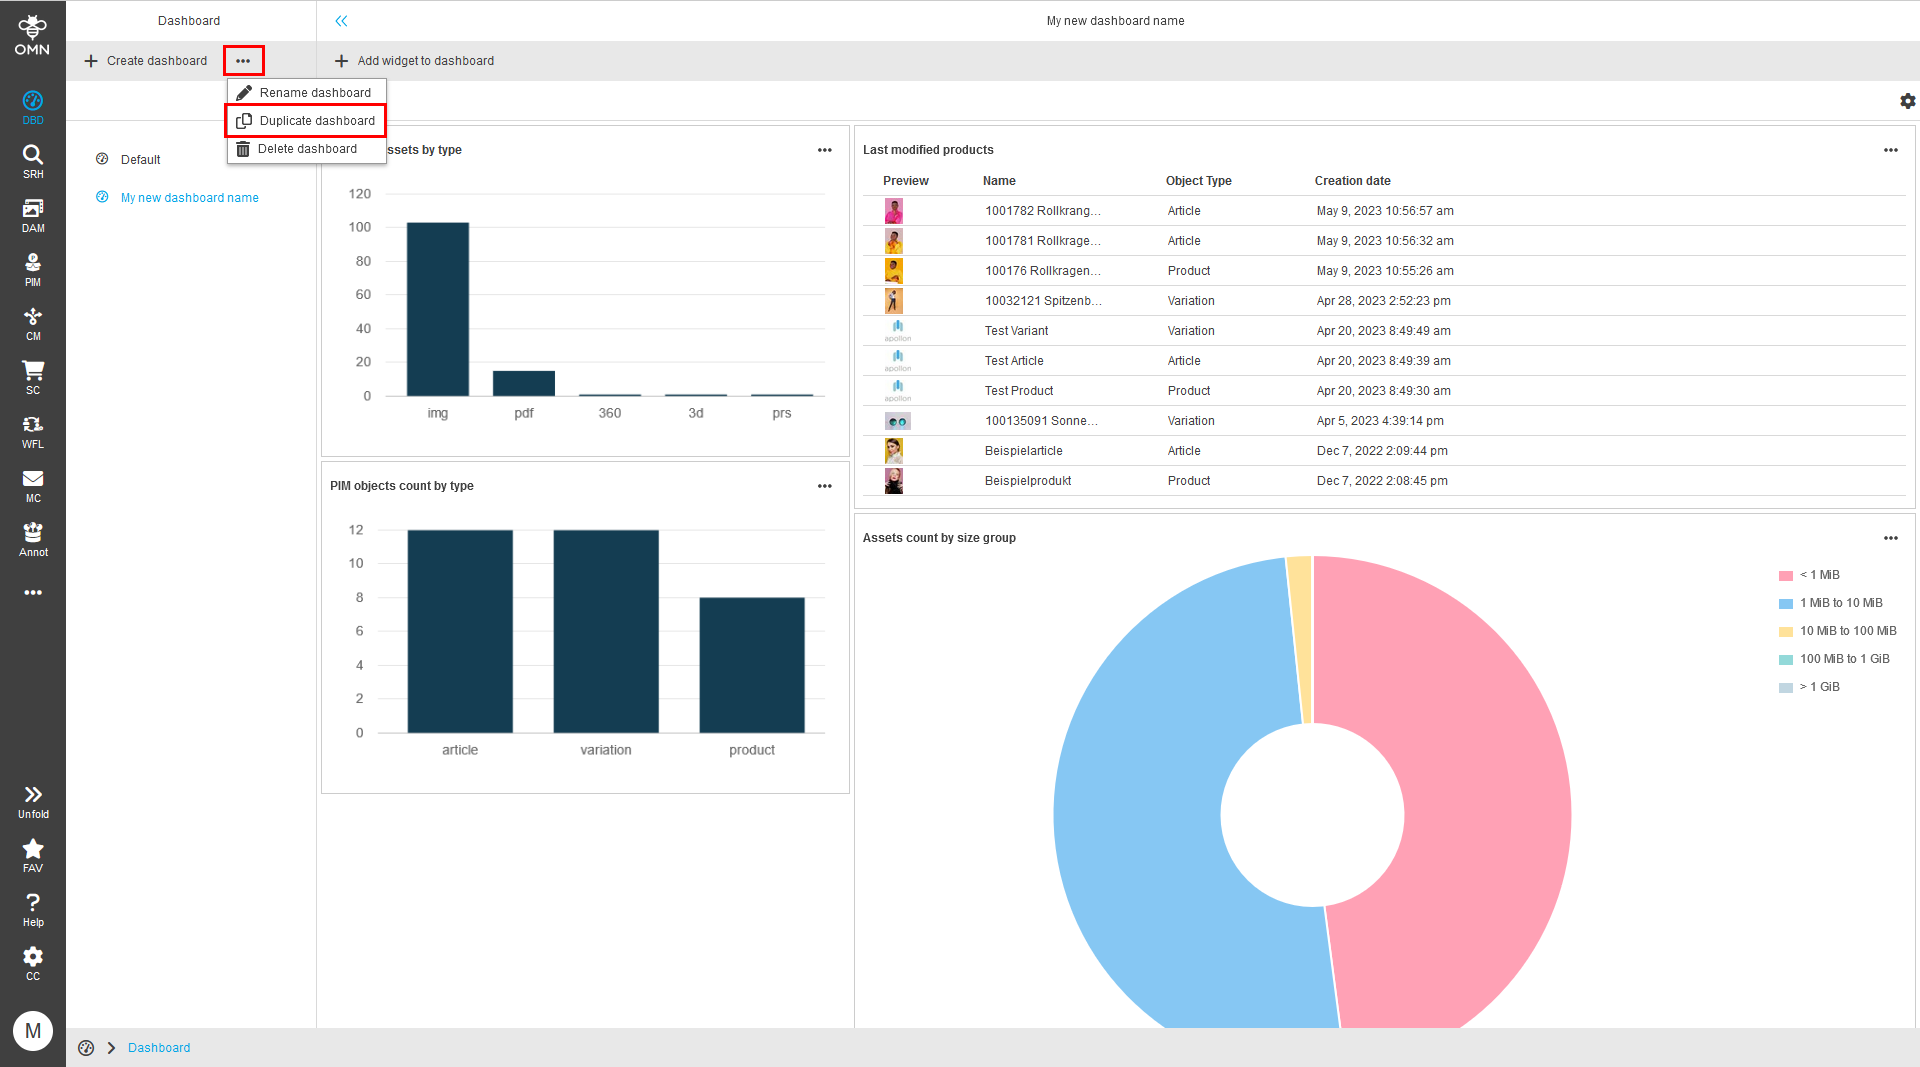
Duplicate a dashboard
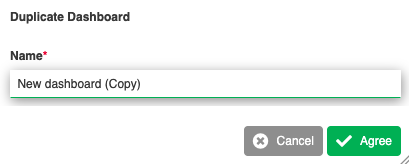
To duplicate a dashboard click the three dots near the "Create dashboard" button and select "Duplicate" from the dropdown menu.
Enter the title/name for the new dashboard in the following dialog and click the "Save" button to confirm the change.
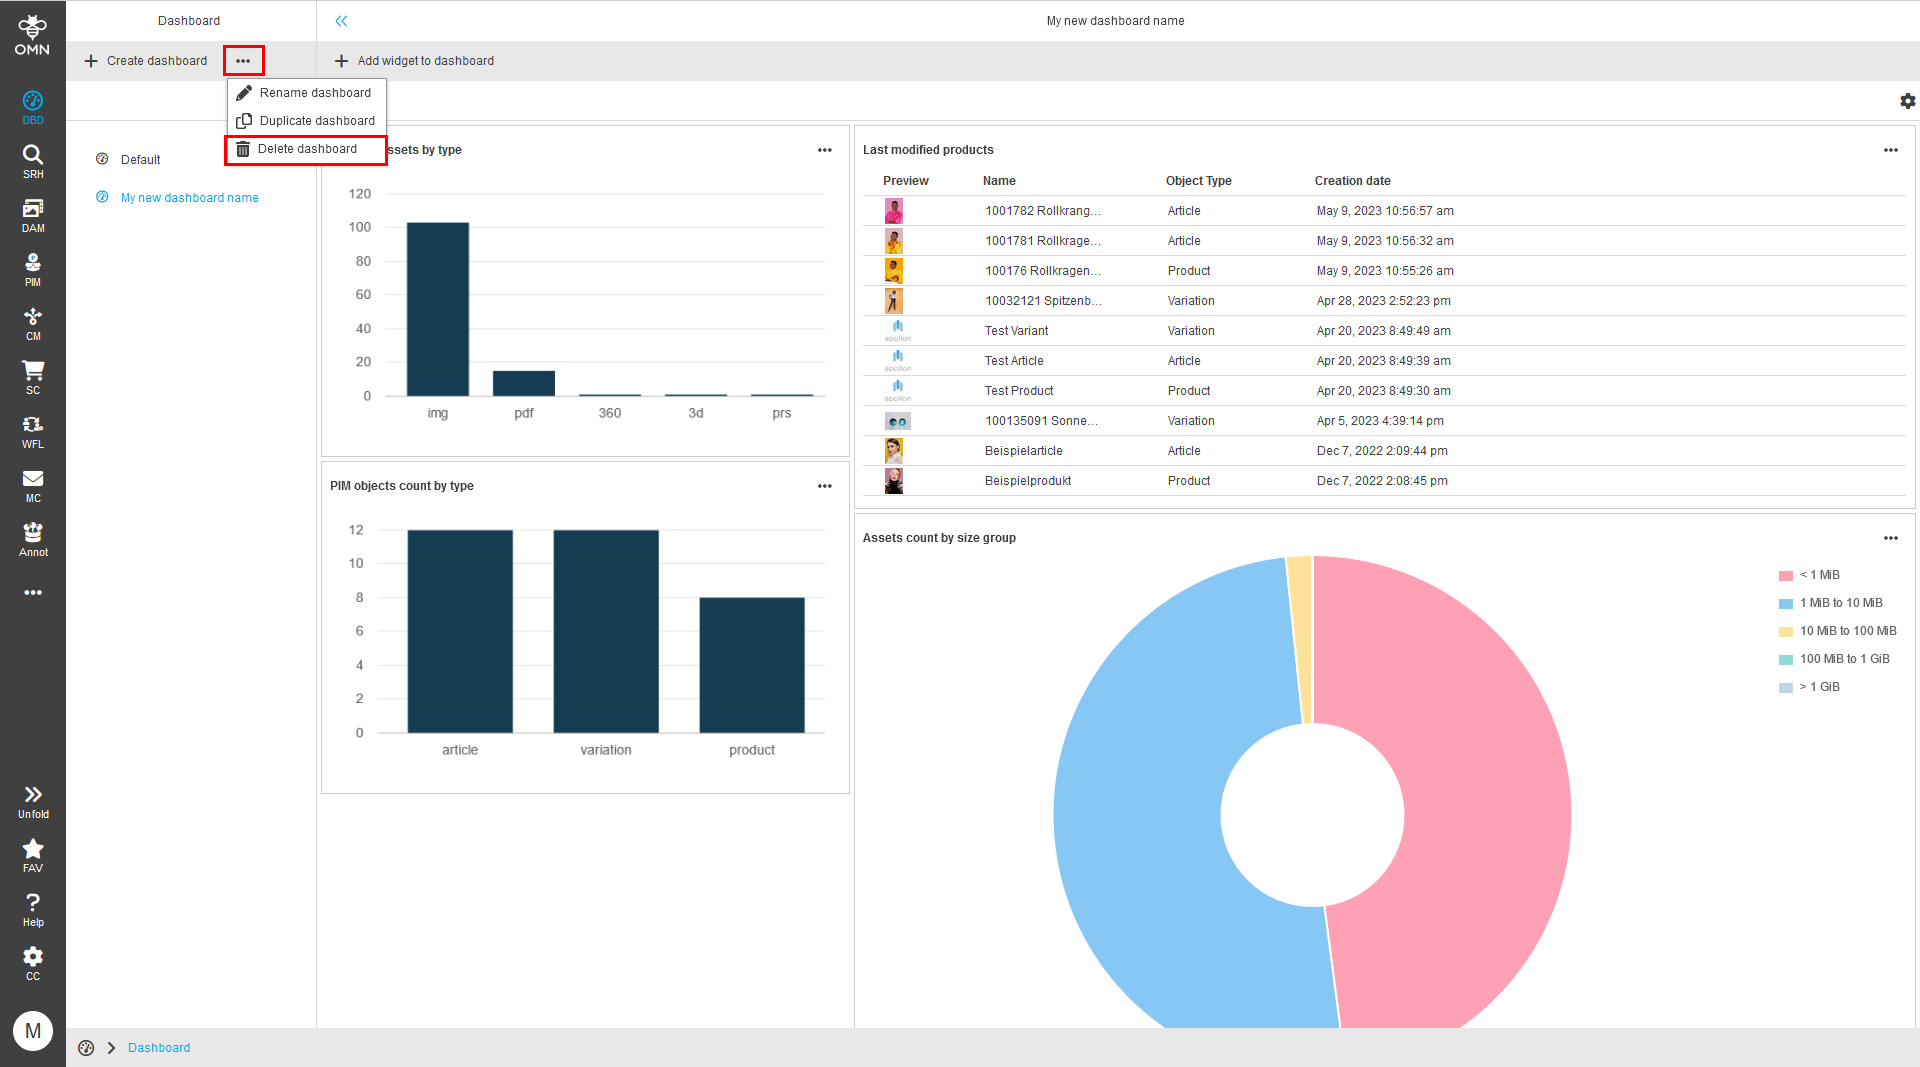
Delete a dashboard
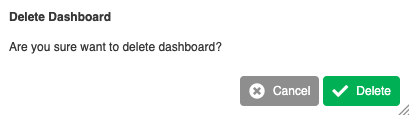
To delete a dashboard click the three dots near the "Create dashboard" button and select "Delete" from the dropdown menu.
Confirm the deletion of the dashboard by clicking "Confirm" in the following dialog.
Change dashboard layout
To change the layout of a dashboard click the gear icon in the upper right corner of the dashboard.
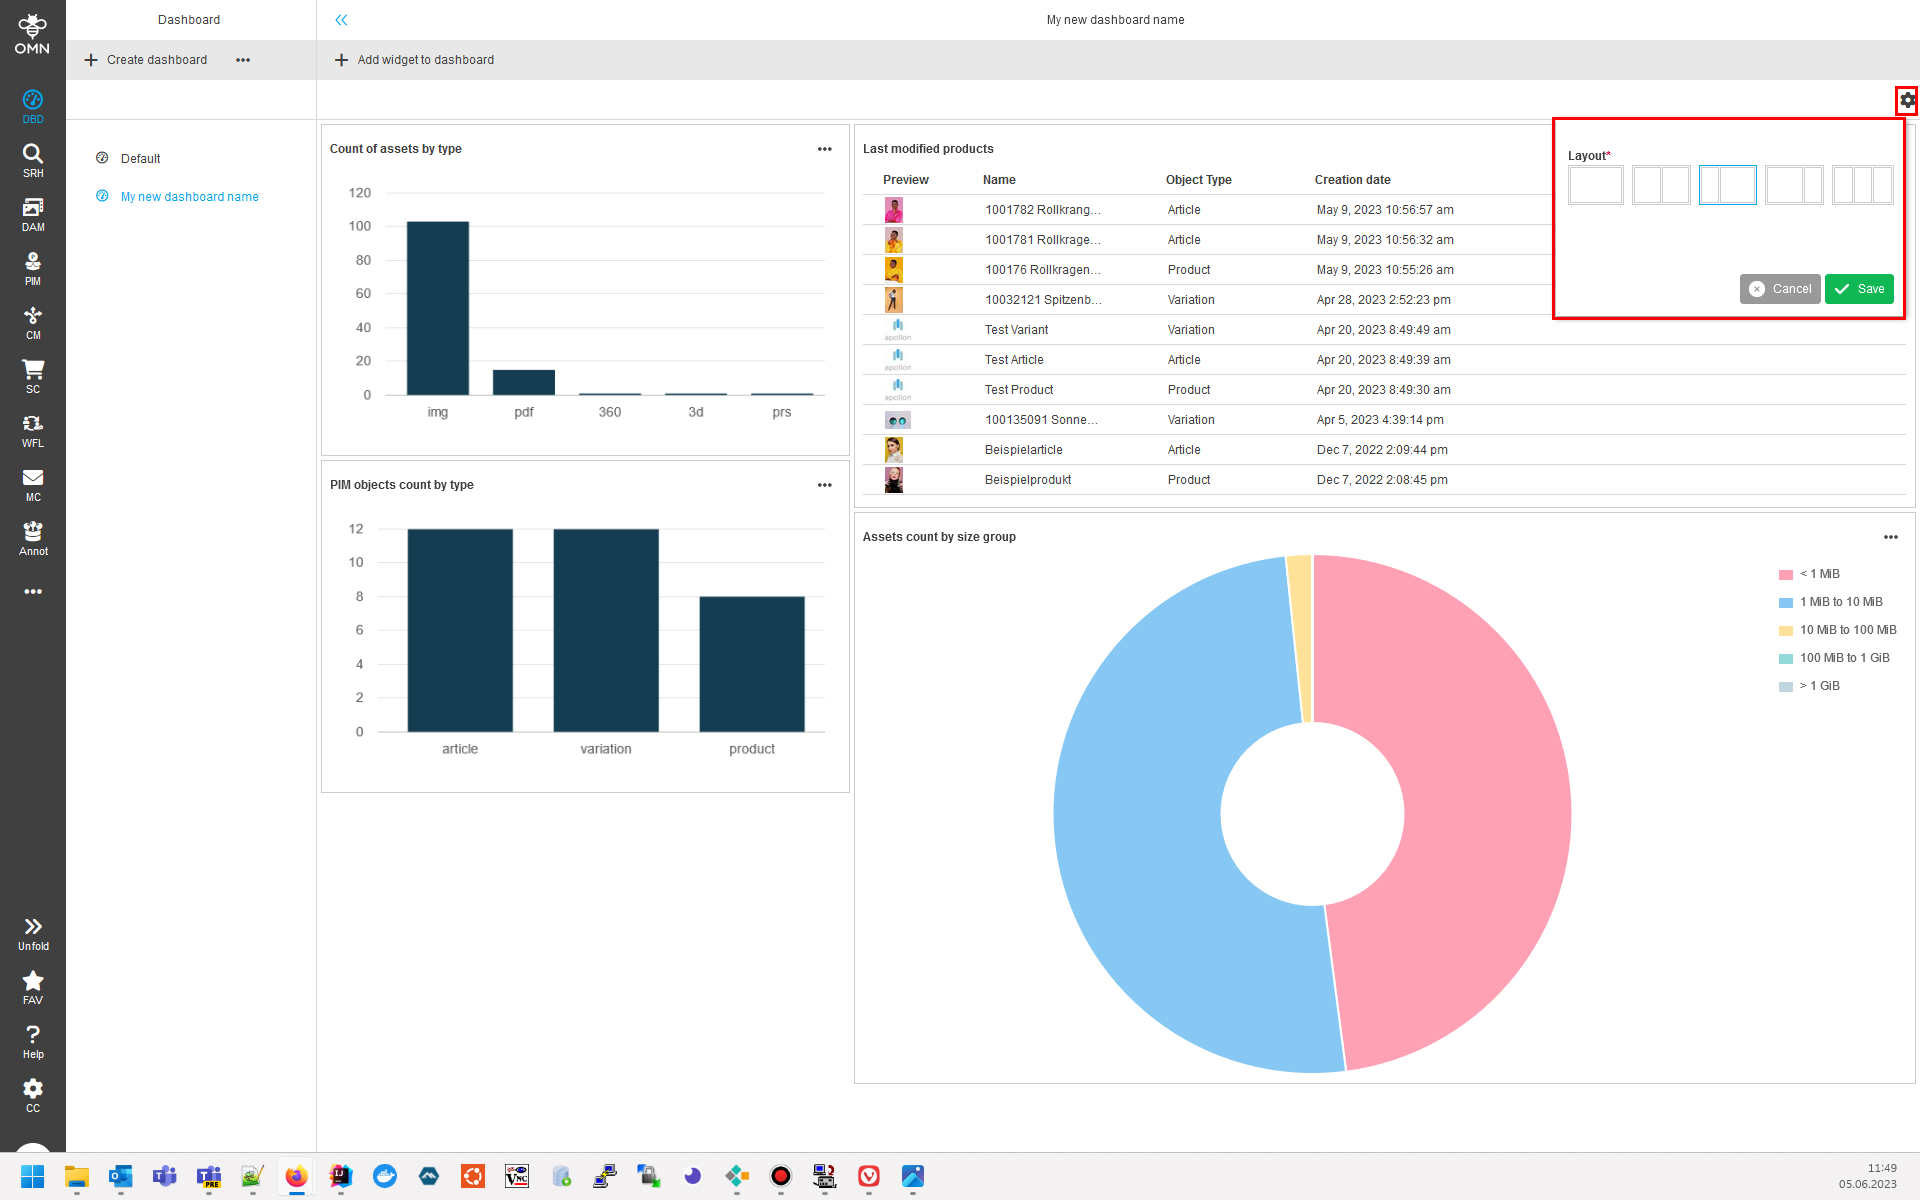
Choose the desired layout in the popup and click the "Save" button to confirm the change.
Note: If the new layout has fewer columns than the existing, the widgets will be re-arranged.
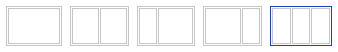
Dashboard-Layouts
The dashboard provides several layouts to organize the widgets in columns.
| Description | |
|---|---|
|
1 Column using the whole screen width |
|
2 Columns - each using ½ of the screen width |
|
2 Columns - left column uses ⅓ and right column ⅔ of the screen width |
|
2 Columns - left column uses ⅔ and right column ⅓ of the screen width |
|
3 Columns - each using ⅓ of the screen width |


Widgets
Widgets are small graphical user interface components which can be placed inside the columns of the dashboard. Each widget visualizes the data for a single business case. There are various forms of representation such as pie charts, bar graphs, tables and single values.
Predefined widgets
| Business case | Widget type | Configurable | Sender/Receiver |
|---|---|---|---|
Count of assets |
|
no |
- |
Count of assets by type |
|
no |
- |
Count of channel objects by type |
|
no |
- |
Count of assets by root node |
|
no |
- |
Last modified products |
|
Sender |
|
Count of assets by size group |
|
no |
- |
Last modified assets |
|
Sender |
|
PIM objects count by type |
|
no |
- |
MAM upload activity |
|
- |
|
Statistic of asset objects by specific attribute |
|
- |
|
Statistic of channel objects by specific attribute |
|
- |
|
Statistic of product objects by specific attribute |
|
- |
|
Asset objects by specific attribute value |
|
Both |
|
Channel objects by specific attribute value |
|
Both |
|
PIM objects by specific attribute value |
|
Both |
|
Count of objects by query |
|
- |
|
Count of objects by query and grouped by specific attribute |
|
- |
|
List of objects by query |
|
Sender |
|
Count objects in index by specific attribute value |
|
Receiver |
|
Count objects in index by specific attribute value grouped by specific attribute |
|
Sender |
|
Average value of objects attribute in index by specific attribute value |
|
Receiver |
Configuration options
The title of every widget is adjustable.
Beside the title some widgets allow further customisations by editing its configuration.
Last modified products
| Option | Description |
|---|---|
Count |
Amount of products to be displayed within the table |
Preview column |
Display a preview image in the first column of the result table |
Columns |
Multiple product attributes can be added as columns to the result table |
Last modified assets
| Option | Description |
|---|---|
Count |
Amount of assets to be displayed within the table |
Root node |
Root node to which the assets should belong to |
Preview column |
Display a preview image in the first column of the result table |
Columns |
Multiple asset attributes can be added as columns to the result table |
MAM upload activity
| Option | Description |
|---|---|
Count |
Amount of days, weeks, months, quarters, years to be displayed |
Time period |
Aggregate the uploads by the specified time period (day, week, month, quarter, year) |
Statistic of asset objects by specific attribute
| Option | Description |
|---|---|
Attribute |
Asset object attribute by which the result should be aggregated |
Statistic of channel objects by specific attribute
| Option | Description |
|---|---|
Attribute |
Channel object attribute by which the result should be aggregated |
Statistic of product objects by specific attribute
| Option | Description |
|---|---|
Attribute |
Product object attribute by which the result should be aggregated |
Asset objects by specific attribute value
| Option | Description |
|---|---|
Count |
Amount of asset objects to be displayed within the table |
Sort attribute |
Asset object attribute by which the result should be sorted |
Sort direction |
Result should be sorted ascending or descending |
Attribute |
Asset object attribute by which the result should be filtered |
Attribute value |
Value of the asset object attribute by which the result should be filtered |
Preview column |
Display a preview image in the first column of the result table |
Columns |
Multiple asset attributes can be added as columns to the result table |
Channel objects by specific attribute value
| Option | Description |
|---|---|
Count |
Amount of channel objects to be displayed within the table |
Sort attribute |
Channel object attribute by which the result should be sorted |
Sort direction |
Result should be sorted ascending or descending |
Attribute |
Channel object attribute by which the result should be filtered |
Attribute value |
Value of the channel object attribute by which the result should be filtered |
Preview column |
Display a preview image in the first column of the result table |
Columns |
Multiple asset attributes can be added as columns to the result table |
PIM objects by specific attribute value
| Option | Description |
|---|---|
Count |
Amount of PIM objects to be displayed within the table |
Sort attribute |
PIM object attribute by which the result should be sorted |
Sort direction |
Result should be sorted ascending or descending |
Attribute |
PIM object attribute by which the result should be filtered |
Attribute value |
Value of the PIM object attribute by which the result should be filtered |
Preview column |
Display a preview image in the first column of the result table |
Columns |
Multiple asset attributes can be added as columns to the result table |
Count of objects by query and grouped by specific attribute
| Option | Description |
|---|---|
Information type |
TODO |
Query string |
TODO |
Group by |
TODO |
List of objects by query
| Option | Description |
|---|---|
Information type |
TODO |
Query string |
TODO |
Preview column |
Display a preview image in the first column of the result table |
Columns |
Multiple attributes can be added as columns to the result table |
Count |
Amount of objects to be displayed within the table |
Sort direction |
Result should be sorted ascending or descending |
Sort attribute |
TODO |
Count objects in index by specific attribute value
| Option | Description |
|---|---|
Information type |
TODO |
Attribute |
Object attribute by which the result should be filtered |
Attribute value |
Value of the object attribute by which the result should be filtered |
Use preview in table widget
To add a column with previews to a table widget, make sure to navigate to the settings of the table widget by clicking the three dots in the upper right corner of the widget and selecting "Edit" in the dropdown menu.

Activate the checkbox 'Preview column' and save the settings.

The preview column is now visible in the table widget.

Step-by-step guide - Creating dashboards and widgets
This guide provides step-by-step instructions for creating and customizing a dashboard with widgets, making it an indispensable resource for users who want to improve their data visualization skills. The instructions enable users to efficiently set up a personalized dashboard that meets their specific requirements and enables better asset management and status tracking.
The guide can be downloaded here: Create and Customize a Dashboard with Widgets